BannerCorporation BANR full analysis,charts,indicators,moving averages,SMA,DMA,EMA,ADX,MACD,RSIBanner Corporation BANR WideScreen charts, DMA,SMA,EMA technical analysis, forecast prediction, by indicators ADX,MACD,RSI,CCI USA stock exchange
operates under Finance sector & deals in Major Banks
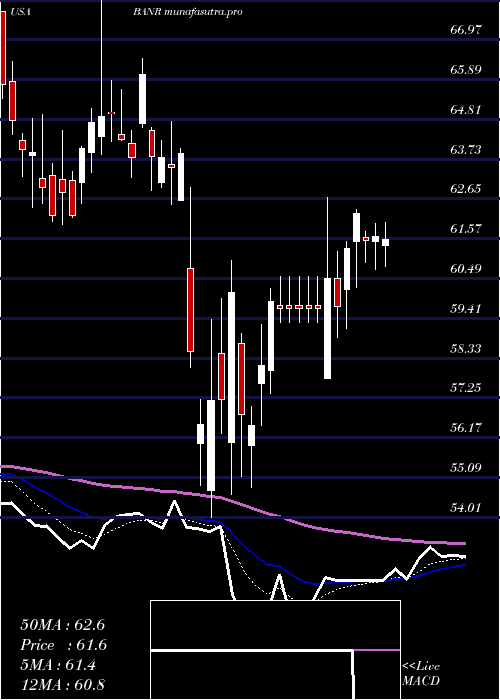
Daily price and charts and targets BannerCorporation Strong Daily Stock price targets for BannerCorporation BANR are 62.91 and 63.87 | Daily Target 1 | 62.22 | | Daily Target 2 | 62.63 | | Daily Target 3 | 63.18 | | Daily Target 4 | 63.59 | | Daily Target 5 | 64.14 |
Daily price and volume Banner Corporation
| Date |
Closing |
Open |
Range |
Volume |
Tue 21 October 2025 |
63.04 (0.37%) |
62.77 |
62.77 - 63.73 |
0.8367 times |
Mon 20 October 2025 |
62.81 (1.72%) |
61.93 |
61.73 - 62.91 |
0.9125 times |
Fri 17 October 2025 |
61.75 (-1.07%) |
62.93 |
61.33 - 63.30 |
1.601 times |
Thu 16 October 2025 |
62.42 (-0.32%) |
63.46 |
60.75 - 65.18 |
1.5737 times |
Wed 15 October 2025 |
62.62 (-2.16%) |
64.19 |
62.32 - 64.19 |
0.9122 times |
Tue 14 October 2025 |
64.00 (3.78%) |
61.29 |
61.29 - 64.18 |
0.9504 times |
Mon 13 October 2025 |
61.67 (1.03%) |
61.91 |
61.15 - 62.02 |
0.6021 times |
Fri 10 October 2025 |
61.04 (-2.93%) |
62.89 |
60.94 - 63.72 |
1.2277 times |
Thu 09 October 2025 |
62.88 (-1.63%) |
63.86 |
62.48 - 63.86 |
0.6089 times |
Wed 08 October 2025 |
63.92 (1.32%) |
63.24 |
62.44 - 64.04 |
0.7749 times |
Tue 07 October 2025 |
63.09 (0.06%) |
63.27 |
62.80 - 64.00 |
0.8353 times |
Weekly price and charts BannerCorporation Strong weekly Stock price targets for BannerCorporation BANR are 62.39 and 64.39 | Weekly Target 1 | 60.83 | | Weekly Target 2 | 61.94 | | Weekly Target 3 | 62.833333333333 | | Weekly Target 4 | 63.94 | | Weekly Target 5 | 64.83 |
Weekly price and volumes for Banner Corporation
| Date |
Closing |
Open |
Range |
Volume |
Tue 21 October 2025 |
63.04 (2.09%) |
61.93 |
61.73 - 63.73 |
0.5962 times |
Fri 17 October 2025 |
61.75 (1.16%) |
61.91 |
60.75 - 65.18 |
1.9222 times |
Fri 10 October 2025 |
61.04 (-5%) |
64.70 |
60.94 - 65.20 |
1.5323 times |
Fri 03 October 2025 |
64.25 (-1.38%) |
65.12 |
62.70 - 66.11 |
1.3575 times |
Fri 26 September 2025 |
65.15 (-2.95%) |
67.12 |
64.73 - 67.21 |
0.7318 times |
Fri 19 September 2025 |
67.13 (1.5%) |
66.23 |
63.95 - 67.86 |
1.5768 times |
Fri 12 September 2025 |
66.14 (-2.25%) |
67.90 |
66.06 - 68.06 |
0.8048 times |
Fri 05 September 2025 |
67.66 (0.94%) |
66.20 |
65.79 - 68.97 |
0.5455 times |
Fri 29 August 2025 |
67.03 (0%) |
67.50 |
66.97 - 67.84 |
0.1362 times |
Fri 29 August 2025 |
67.03 (-1%) |
67.33 |
65.02 - 68.06 |
0.7966 times |
Fri 22 August 2025 |
67.71 (6.26%) |
63.51 |
63.36 - 67.93 |
0.8723 times |
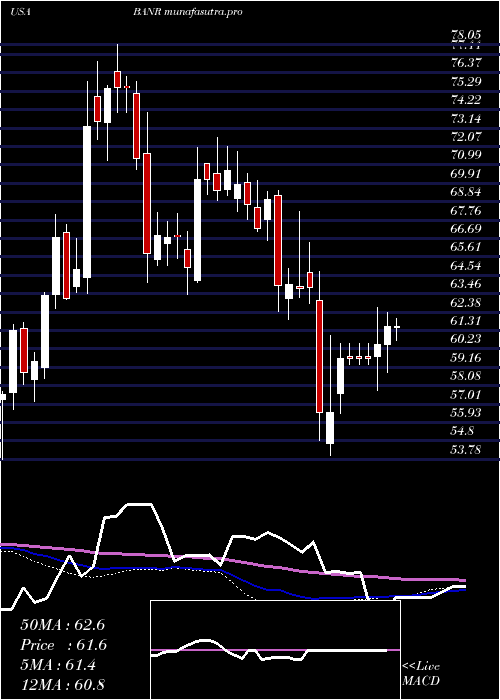
Monthly price and charts BannerCorporation Strong monthly Stock price targets for BannerCorporation BANR are 59.64 and 64.15 | Monthly Target 1 | 58.51 | | Monthly Target 2 | 60.77 | | Monthly Target 3 | 63.016666666667 | | Monthly Target 4 | 65.28 | | Monthly Target 5 | 67.53 |
Monthly price and volumes Banner Corporation
| Date |
Closing |
Open |
Range |
Volume |
Tue 21 October 2025 |
63.04 (-3.76%) |
65.03 |
60.75 - 65.26 |
0.9927 times |
Tue 30 September 2025 |
65.50 (-2.28%) |
66.20 |
63.95 - 68.97 |
0.8273 times |
Fri 29 August 2025 |
67.03 (7.97%) |
61.60 |
60.48 - 68.06 |
0.8838 times |
Thu 31 July 2025 |
62.08 (-3.23%) |
63.70 |
61.76 - 69.83 |
1.2108 times |
Mon 30 June 2025 |
64.15 (4.06%) |
61.42 |
60.02 - 64.82 |
0.8944 times |
Fri 30 May 2025 |
61.65 (0.83%) |
61.14 |
60.70 - 66.16 |
0.8825 times |
Wed 30 April 2025 |
61.14 (-4.12%) |
63.59 |
54.01 - 64.74 |
1.1564 times |
Mon 31 March 2025 |
63.77 (-7.55%) |
69.21 |
61.96 - 69.52 |
1.0999 times |
Fri 28 February 2025 |
68.98 (-2.39%) |
69.00 |
66.54 - 71.75 |
0.8656 times |
Fri 31 January 2025 |
70.67 (5.94%) |
67.10 |
63.40 - 72.58 |
1.1865 times |
Tue 31 December 2024 |
66.71 (-11.67%) |
75.16 |
64.11 - 75.85 |
0.8397 times |

DMA SMA EMA moving averages of Banner Corporation BANR
DMA (daily moving average) of Banner Corporation BANR
| DMA period | DMA value | | 5 day DMA | 62.53 | | 12 day DMA | 62.69 | | 20 day DMA | 63.56 | | 35 day DMA | 64.87 | | 50 day DMA | 65.2 | | 100 day DMA | 64.72 | | 150 day DMA | 63.75 | | 200 day DMA | 64.81 | EMA (exponential moving average) of Banner Corporation BANR
| EMA period | EMA current | EMA prev | EMA prev2 | | 5 day EMA | 62.69 | 62.51 | 62.36 | | 12 day EMA | 62.97 | 62.96 | 62.99 | | 20 day EMA | 63.47 | 63.52 | 63.59 | | 35 day EMA | 64.07 | 64.13 | 64.21 | | 50 day EMA | 64.76 | 64.83 | 64.91 |
SMA (simple moving average) of Banner Corporation BANR
| SMA period | SMA current | SMA prev | SMA prev2 | | 5 day SMA | 62.53 | 62.72 | 62.49 | | 12 day SMA | 62.69 | 62.79 | 62.87 | | 20 day SMA | 63.56 | 63.7 | 63.86 | | 35 day SMA | 64.87 | 64.98 | 65.1 | | 50 day SMA | 65.2 | 65.24 | 65.23 | | 100 day SMA | 64.72 | 64.71 | 64.71 | | 150 day SMA | 63.75 | 63.76 | 63.77 | | 200 day SMA | 64.81 | 64.83 | 64.85 |
|
|
