BancfirstCorporation BANF full analysis,charts,indicators,moving averages,SMA,DMA,EMA,ADX,MACD,RSIBancfirst Corporation BANF WideScreen charts, DMA,SMA,EMA technical analysis, forecast prediction, by indicators ADX,MACD,RSI,CCI USA stock exchange
operates under Finance sector & deals in Major Banks
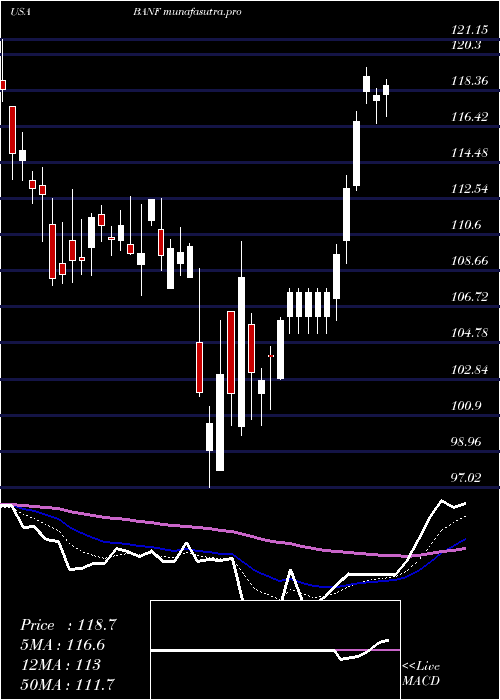
Daily price and charts and targets BancfirstCorporation Strong Daily Stock price targets for BancfirstCorporation BANF are 107.6 and 111.09 | Daily Target 1 | 106.74 | | Daily Target 2 | 108.46 | | Daily Target 3 | 110.23 | | Daily Target 4 | 111.95 | | Daily Target 5 | 113.72 |
Daily price and volume Bancfirst Corporation
| Date |
Closing |
Open |
Range |
Volume |
Thu 04 December 2025 |
110.18 (-0.93%) |
110.59 |
108.51 - 112.00 |
0.957 times |
Wed 03 December 2025 |
111.21 (-0.22%) |
112.14 |
110.26 - 113.06 |
1.2285 times |
Tue 02 December 2025 |
111.46 (0.43%) |
111.90 |
110.00 - 112.28 |
1.0239 times |
Mon 01 December 2025 |
110.98 (0.13%) |
109.86 |
107.66 - 112.53 |
0.8014 times |
Fri 28 November 2025 |
110.84 (-0.69%) |
111.53 |
107.44 - 112.01 |
0.5555 times |
Wed 26 November 2025 |
111.61 (-1.4%) |
112.47 |
111.23 - 113.88 |
1.4059 times |
Tue 25 November 2025 |
113.20 (1.98%) |
111.77 |
111.77 - 114.93 |
0.8885 times |
Mon 24 November 2025 |
111.00 (0.52%) |
110.04 |
108.61 - 112.00 |
0.6761 times |
Fri 21 November 2025 |
110.43 (3.69%) |
106.69 |
105.55 - 112.00 |
1.297 times |
Thu 20 November 2025 |
106.50 (-1.14%) |
108.99 |
105.55 - 109.72 |
1.1663 times |
Wed 19 November 2025 |
107.73 (0.07%) |
107.65 |
107.18 - 109.26 |
0.8504 times |
Weekly price and charts BancfirstCorporation Strong weekly Stock price targets for BancfirstCorporation BANF are 108.92 and 114.32 | Weekly Target 1 | 104.9 | | Weekly Target 2 | 107.54 | | Weekly Target 3 | 110.3 | | Weekly Target 4 | 112.94 | | Weekly Target 5 | 115.7 |
Weekly price and volumes for Bancfirst Corporation
| Date |
Closing |
Open |
Range |
Volume |
Thu 04 December 2025 |
110.18 (-0.6%) |
109.86 |
107.66 - 113.06 |
1.0364 times |
Fri 28 November 2025 |
110.84 (0.37%) |
110.04 |
107.44 - 114.93 |
0.9112 times |
Fri 21 November 2025 |
110.43 (-0.63%) |
110.97 |
105.55 - 112.00 |
1.4455 times |
Fri 14 November 2025 |
111.13 (0.38%) |
111.19 |
108.48 - 114.90 |
1.0825 times |
Fri 07 November 2025 |
110.71 (1.7%) |
107.91 |
107.00 - 111.39 |
0.8533 times |
Fri 31 October 2025 |
108.86 (0%) |
108.90 |
107.92 - 109.38 |
0.2742 times |
Fri 31 October 2025 |
108.86 (-3.47%) |
113.07 |
107.92 - 113.19 |
1.0505 times |
Fri 24 October 2025 |
112.77 (-0.14%) |
113.10 |
111.11 - 115.09 |
0.9329 times |
Fri 17 October 2025 |
112.93 (-5.96%) |
121.38 |
112.54 - 126.14 |
1.4164 times |
Fri 10 October 2025 |
120.09 (-5.09%) |
127.41 |
119.85 - 128.95 |
0.9972 times |
Fri 03 October 2025 |
126.53 (-3.26%) |
130.99 |
123.50 - 131.40 |
1.0067 times |
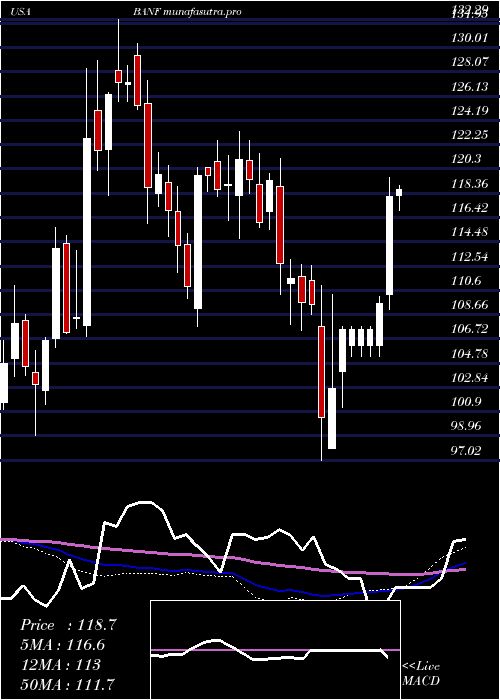
Monthly price and charts BancfirstCorporation Strong monthly Stock price targets for BancfirstCorporation BANF are 108.92 and 114.32 | Monthly Target 1 | 104.9 | | Monthly Target 2 | 107.54 | | Monthly Target 3 | 110.3 | | Monthly Target 4 | 112.94 | | Monthly Target 5 | 115.7 |
Monthly price and volumes Bancfirst Corporation
| Date |
Closing |
Open |
Range |
Volume |
Thu 04 December 2025 |
110.18 (-0.6%) |
109.86 |
107.66 - 113.06 |
0.2349 times |
Fri 28 November 2025 |
110.84 (1.82%) |
107.91 |
105.55 - 114.93 |
0.9729 times |
Fri 31 October 2025 |
108.86 (-13.91%) |
125.52 |
107.92 - 128.95 |
1.1659 times |
Tue 30 September 2025 |
126.45 (-4.9%) |
131.44 |
124.86 - 138.77 |
1.3269 times |
Fri 29 August 2025 |
132.97 (6.79%) |
123.50 |
119.73 - 134.99 |
0.9974 times |
Thu 31 July 2025 |
124.52 (0.73%) |
123.49 |
121.39 - 137.40 |
1.4736 times |
Mon 30 June 2025 |
123.62 (-0.07%) |
123.76 |
117.27 - 126.05 |
0.9815 times |
Fri 30 May 2025 |
123.71 (5%) |
117.78 |
117.04 - 130.08 |
0.8276 times |
Wed 30 April 2025 |
117.82 (7.24%) |
109.06 |
97.02 - 119.87 |
1.075 times |
Mon 31 March 2025 |
109.87 (-7.95%) |
118.91 |
107.36 - 121.15 |
0.9443 times |
Fri 28 February 2025 |
119.36 (0.24%) |
118.22 |
114.73 - 123.29 |
0.7589 times |

DMA SMA EMA moving averages of Bancfirst Corporation BANF
DMA (daily moving average) of Bancfirst Corporation BANF
| DMA period | DMA value | | 5 day DMA | 110.93 | | 12 day DMA | 110.23 | | 20 day DMA | 110.41 | | 35 day DMA | 110.88 | | 50 day DMA | 115.29 | | 100 day DMA | 122.31 | | 150 day DMA | 123.14 | | 200 day DMA | 120.19 | EMA (exponential moving average) of Bancfirst Corporation BANF
| EMA period | EMA current | EMA prev | EMA prev2 | | 5 day EMA | 110.83 | 111.16 | 111.13 | | 12 day EMA | 110.7 | 110.8 | 110.73 | | 20 day EMA | 111.08 | 111.17 | 111.17 | | 35 day EMA | 113.63 | 113.83 | 113.98 | | 50 day EMA | 116.19 | 116.43 | 116.64 |
SMA (simple moving average) of Bancfirst Corporation BANF
| SMA period | SMA current | SMA prev | SMA prev2 | | 5 day SMA | 110.93 | 111.22 | 111.62 | | 12 day SMA | 110.23 | 109.96 | 109.96 | | 20 day SMA | 110.41 | 110.43 | 110.31 | | 35 day SMA | 110.88 | 111.24 | 111.65 | | 50 day SMA | 115.29 | 115.71 | 116.08 | | 100 day SMA | 122.31 | 122.47 | 122.67 | | 150 day SMA | 123.14 | 123.19 | 123.24 | | 200 day SMA | 120.19 | 120.24 | 120.28 |
|
|
