BrookfieldAsset BAM full analysis,charts,indicators,moving averages,SMA,DMA,EMA,ADX,MACD,RSIBrookfield Asset BAM WideScreen charts, DMA,SMA,EMA technical analysis, forecast prediction, by indicators ADX,MACD,RSI,CCI USA stock exchange
operates under Consumer Services sector & deals in Building Operators
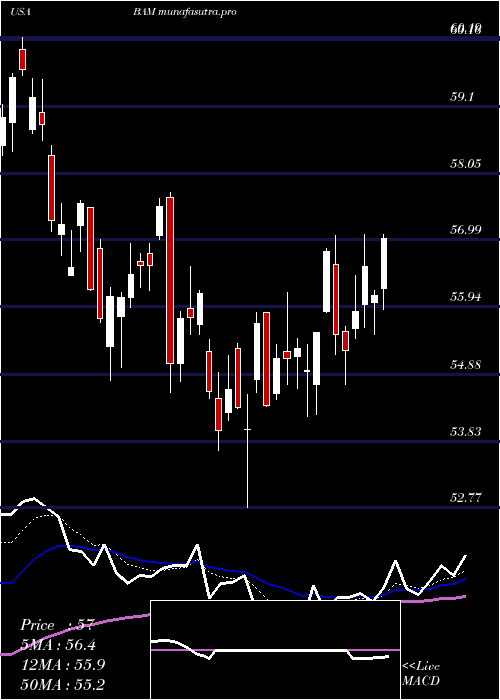
Daily price and charts and targets BrookfieldAsset Strong Daily Stock price targets for BrookfieldAsset BAM are 54.1 and 54.83 | Daily Target 1 | 53.93 | | Daily Target 2 | 54.27 | | Daily Target 3 | 54.663333333333 | | Daily Target 4 | 55 | | Daily Target 5 | 55.39 |
Daily price and volume Brookfield Asset
| Date |
Closing |
Open |
Range |
Volume |
Mon 20 October 2025 |
54.60 (0.74%) |
54.64 |
54.33 - 55.06 |
0.5077 times |
Fri 17 October 2025 |
54.20 (0.07%) |
54.17 |
53.62 - 54.77 |
1.3659 times |
Thu 16 October 2025 |
54.16 (-3.7%) |
56.40 |
54.06 - 56.42 |
1.3298 times |
Wed 15 October 2025 |
56.24 (-0.53%) |
57.42 |
55.96 - 57.56 |
0.7437 times |
Tue 14 October 2025 |
56.54 (-0.74%) |
56.25 |
55.74 - 57.16 |
1.4303 times |
Mon 13 October 2025 |
56.96 (3.45%) |
56.06 |
55.92 - 57.33 |
0.7966 times |
Fri 10 October 2025 |
55.06 (-6.31%) |
59.18 |
55.04 - 59.33 |
1.5461 times |
Thu 09 October 2025 |
58.77 (0.65%) |
58.43 |
58.02 - 58.77 |
0.8229 times |
Wed 08 October 2025 |
58.39 (0.74%) |
58.55 |
57.61 - 58.94 |
0.6286 times |
Tue 07 October 2025 |
57.96 (0.31%) |
58.11 |
57.72 - 58.75 |
0.8284 times |
Mon 06 October 2025 |
57.78 (-0.03%) |
58.17 |
56.59 - 58.27 |
0.5463 times |
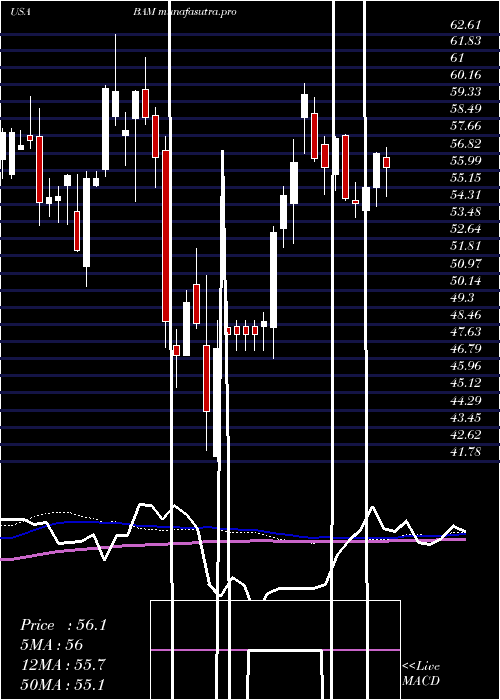
Weekly price and charts BrookfieldAsset Strong weekly Stock price targets for BrookfieldAsset BAM are 54.1 and 54.83 | Weekly Target 1 | 53.93 | | Weekly Target 2 | 54.27 | | Weekly Target 3 | 54.663333333333 | | Weekly Target 4 | 55 | | Weekly Target 5 | 55.39 |
Weekly price and volumes for Brookfield Asset
| Date |
Closing |
Open |
Range |
Volume |
Mon 20 October 2025 |
54.60 (0.74%) |
54.64 |
54.33 - 55.06 |
0.1066 times |
Fri 17 October 2025 |
54.20 (-1.56%) |
56.06 |
53.62 - 57.56 |
1.1899 times |
Fri 10 October 2025 |
55.06 (-4.74%) |
58.17 |
55.04 - 59.33 |
0.9182 times |
Fri 03 October 2025 |
57.80 (-0.5%) |
58.36 |
55.70 - 58.89 |
0.9462 times |
Fri 26 September 2025 |
58.09 (-3.22%) |
59.50 |
57.57 - 62.57 |
1.0671 times |
Fri 19 September 2025 |
60.02 (6.1%) |
56.80 |
56.70 - 60.68 |
1.4261 times |
Fri 12 September 2025 |
56.57 (-2.92%) |
58.24 |
55.29 - 58.47 |
1.5346 times |
Fri 05 September 2025 |
58.27 (-3.14%) |
59.44 |
57.52 - 59.88 |
1.3482 times |
Fri 29 August 2025 |
60.16 (0%) |
60.43 |
59.46 - 60.61 |
0.2166 times |
Fri 29 August 2025 |
60.16 (-1.47%) |
61.00 |
59.46 - 61.66 |
1.2464 times |
Fri 22 August 2025 |
61.06 (-0.57%) |
61.28 |
58.53 - 61.37 |
0.6773 times |
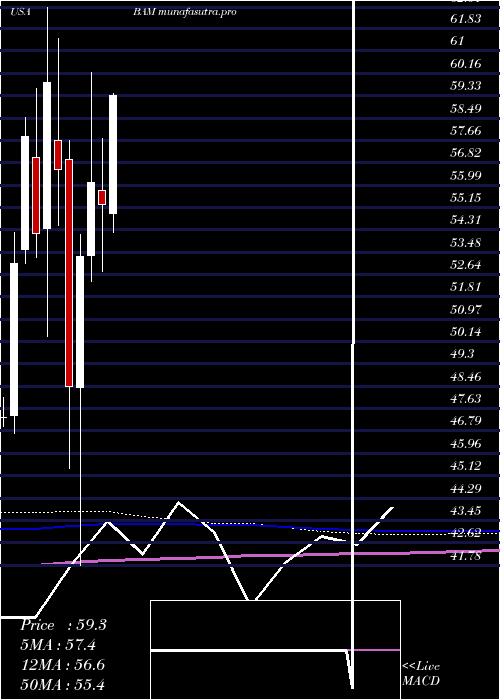
Monthly price and charts BrookfieldAsset Strong monthly Stock price targets for BrookfieldAsset BAM are 51.26 and 56.97 | Monthly Target 1 | 50.14 | | Monthly Target 2 | 52.37 | | Monthly Target 3 | 55.85 | | Monthly Target 4 | 58.08 | | Monthly Target 5 | 61.56 |
Monthly price and volumes Brookfield Asset
| Date |
Closing |
Open |
Range |
Volume |
Mon 20 October 2025 |
54.60 (-4.11%) |
56.60 |
53.62 - 59.33 |
0.5471 times |
Tue 30 September 2025 |
56.94 (-5.35%) |
59.44 |
55.29 - 62.57 |
1.1497 times |
Fri 29 August 2025 |
60.16 (-2.45%) |
60.27 |
58.53 - 64.10 |
0.9066 times |
Thu 31 July 2025 |
61.67 (11.56%) |
54.92 |
54.21 - 63.53 |
0.9628 times |
Mon 30 June 2025 |
55.28 (-1.46%) |
55.79 |
52.77 - 57.74 |
1.4952 times |
Fri 30 May 2025 |
56.10 (5.19%) |
53.36 |
52.39 - 60.19 |
1.2238 times |
Wed 30 April 2025 |
53.33 (10.07%) |
48.42 |
41.78 - 54.15 |
1.1805 times |
Mon 31 March 2025 |
48.45 (-14.37%) |
56.96 |
45.41 - 57.65 |
1.059 times |
Fri 28 February 2025 |
56.58 (-5.43%) |
57.67 |
54.48 - 61.47 |
0.8074 times |
Fri 31 January 2025 |
59.83 (10.41%) |
54.37 |
50.31 - 62.61 |
0.6679 times |
Tue 31 December 2024 |
54.19 (-6.26%) |
57.02 |
53.28 - 59.58 |
0.2766 times |
DMA SMA EMA moving averages of Brookfield Asset BAM
DMA (daily moving average) of Brookfield Asset BAM
| DMA period | DMA value | | 5 day DMA | 55.15 | | 12 day DMA | 56.54 | | 20 day DMA | 57.13 | | 35 day DMA | 57.6 | | 50 day DMA | 58.54 | | 100 day DMA | 58.17 | | 150 day DMA | 56.04 | | 200 day DMA | 55.91 | EMA (exponential moving average) of Brookfield Asset BAM
| EMA period | EMA current | EMA prev | EMA prev2 | | 5 day EMA | 55.07 | 55.3 | 55.85 | | 12 day EMA | 56.07 | 56.34 | 56.73 | | 20 day EMA | 56.76 | 56.99 | 57.28 | | 35 day EMA | 57.69 | 57.87 | 58.09 | | 50 day EMA | 58.45 | 58.61 | 58.79 |
SMA (simple moving average) of Brookfield Asset BAM
| SMA period | SMA current | SMA prev | SMA prev2 | | 5 day SMA | 55.15 | 55.62 | 55.79 | | 12 day SMA | 56.54 | 56.72 | 56.85 | | 20 day SMA | 57.13 | 57.48 | 57.77 | | 35 day SMA | 57.6 | 57.76 | 57.93 | | 50 day SMA | 58.54 | 58.68 | 58.82 | | 100 day SMA | 58.17 | 58.2 | 58.23 | | 150 day SMA | 56.04 | 56 | 55.95 | | 200 day SMA | 55.91 | 55.91 | 55.91 |
|
|
