BoeingCompany BA full analysis,charts,indicators,moving averages,SMA,DMA,EMA,ADX,MACD,RSIBoeing Company BA WideScreen charts, DMA,SMA,EMA technical analysis, forecast prediction, by indicators ADX,MACD,RSI,CCI USA stock exchange
operates under Capital Goods sector & deals in Aerospace
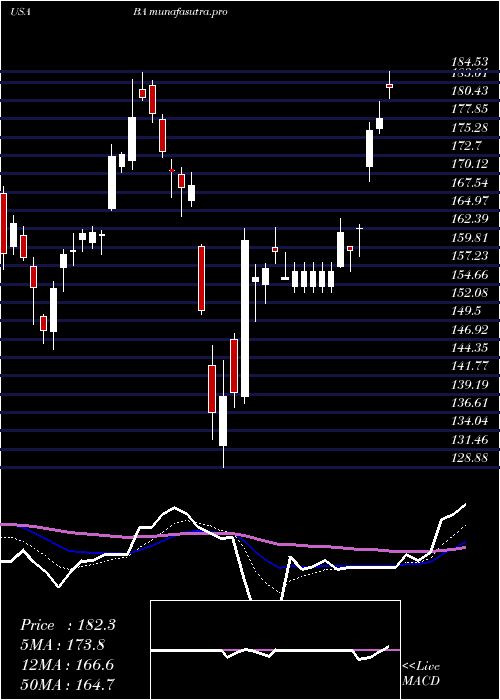
Daily price and charts and targets BoeingCompany Strong Daily Stock price targets for BoeingCompany BA are 197.79 and 202.66 | Daily Target 1 | 196.41 | | Daily Target 2 | 199.17 | | Daily Target 3 | 201.28333333333 | | Daily Target 4 | 204.04 | | Daily Target 5 | 206.15 |
Daily price and volume Boeing Company
| Date |
Closing |
Open |
Range |
Volume |
Thu 04 December 2025 |
201.92 (-0.31%) |
202.85 |
198.53 - 203.40 |
0.6981 times |
Wed 03 December 2025 |
202.54 (-1.38%) |
204.60 |
197.40 - 205.85 |
1.6429 times |
Tue 02 December 2025 |
205.38 (10.15%) |
186.95 |
183.58 - 205.78 |
1.797 times |
Mon 01 December 2025 |
186.46 (-1.34%) |
188.96 |
186.41 - 189.95 |
0.7853 times |
Fri 28 November 2025 |
189.00 (1.11%) |
187.87 |
186.91 - 189.75 |
0.4365 times |
Wed 26 November 2025 |
186.92 (2.49%) |
183.90 |
183.03 - 188.18 |
0.5734 times |
Tue 25 November 2025 |
182.37 (1.87%) |
179.70 |
177.52 - 183.48 |
0.7159 times |
Mon 24 November 2025 |
179.02 (-0.38%) |
181.00 |
177.30 - 181.31 |
0.5828 times |
Fri 21 November 2025 |
179.70 (0.18%) |
180.56 |
176.77 - 181.43 |
1.1755 times |
Thu 20 November 2025 |
179.38 (-3.4%) |
187.74 |
178.42 - 188.10 |
1.5926 times |
Wed 19 November 2025 |
185.70 (-2.05%) |
189.21 |
183.01 - 189.21 |
1.4582 times |
Weekly price and charts BoeingCompany Strong weekly Stock price targets for BoeingCompany BA are 192.75 and 215.02 | Weekly Target 1 | 174.85 | | Weekly Target 2 | 188.38 | | Weekly Target 3 | 197.11666666667 | | Weekly Target 4 | 210.65 | | Weekly Target 5 | 219.39 |
Weekly price and volumes for Boeing Company
| Date |
Closing |
Open |
Range |
Volume |
Thu 04 December 2025 |
201.92 (6.84%) |
188.96 |
183.58 - 205.85 |
1.3239 times |
Fri 28 November 2025 |
189.00 (5.18%) |
181.00 |
177.30 - 189.75 |
0.6208 times |
Fri 21 November 2025 |
179.70 (-7.62%) |
194.84 |
176.77 - 194.84 |
1.4758 times |
Fri 14 November 2025 |
194.52 (-0.02%) |
195.89 |
192.15 - 197.03 |
0.8613 times |
Fri 07 November 2025 |
194.56 (-3.21%) |
202.60 |
191.49 - 204.04 |
0.7454 times |
Fri 31 October 2025 |
201.02 (0%) |
201.25 |
198.30 - 202.60 |
0.3342 times |
Fri 31 October 2025 |
201.02 (-9.18%) |
222.78 |
198.30 - 225.56 |
2.0031 times |
Fri 24 October 2025 |
221.34 (2.83%) |
215.60 |
213.80 - 221.74 |
0.5209 times |
Fri 17 October 2025 |
215.25 (2.14%) |
212.09 |
208.20 - 218.78 |
0.7671 times |
Fri 10 October 2025 |
210.73 (-2.48%) |
216.50 |
210.73 - 226.19 |
1.3475 times |
Fri 03 October 2025 |
216.10 (-2.33%) |
222.37 |
212.83 - 222.81 |
1.1888 times |
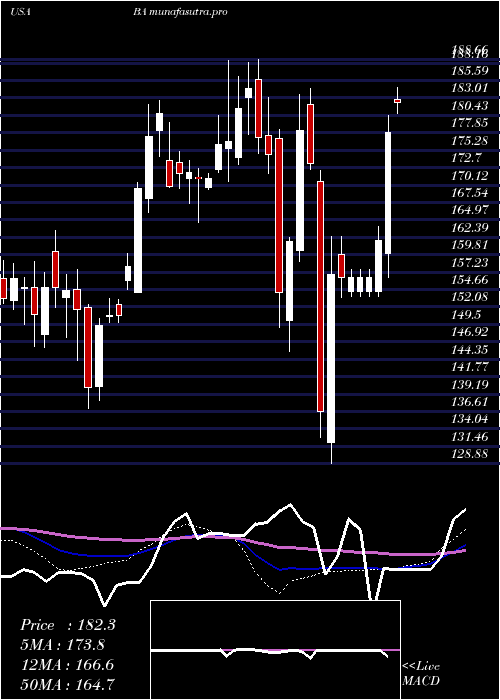
Monthly price and charts BoeingCompany Strong monthly Stock price targets for BoeingCompany BA are 192.75 and 215.02 | Monthly Target 1 | 174.85 | | Monthly Target 2 | 188.38 | | Monthly Target 3 | 197.11666666667 | | Monthly Target 4 | 210.65 | | Monthly Target 5 | 219.39 |
Monthly price and volumes Boeing Company
| Date |
Closing |
Open |
Range |
Volume |
Thu 04 December 2025 |
201.92 (6.84%) |
188.96 |
183.58 - 205.85 |
0.275 times |
Fri 28 November 2025 |
189.00 (-5.98%) |
202.60 |
176.77 - 204.04 |
0.7693 times |
Fri 31 October 2025 |
201.02 (-6.86%) |
214.01 |
198.30 - 226.19 |
1.1464 times |
Tue 30 September 2025 |
215.83 (-8.03%) |
231.28 |
211.43 - 238.33 |
1.1186 times |
Fri 29 August 2025 |
234.68 (5.79%) |
219.45 |
215.90 - 238.05 |
0.8191 times |
Thu 31 July 2025 |
221.84 (5.88%) |
209.50 |
206.77 - 242.69 |
1.0994 times |
Mon 30 June 2025 |
209.53 (1.07%) |
210.98 |
195.28 - 218.80 |
1.1481 times |
Fri 30 May 2025 |
207.32 (13.14%) |
182.85 |
182.03 - 212.28 |
1.1397 times |
Wed 30 April 2025 |
183.24 (7.44%) |
170.00 |
128.88 - 184.53 |
1.3403 times |
Mon 31 March 2025 |
170.55 (-2.34%) |
177.02 |
145.45 - 184.40 |
1.1441 times |
Fri 28 February 2025 |
174.63 (-1.07%) |
174.11 |
171.83 - 188.66 |
0.7875 times |

DMA SMA EMA moving averages of Boeing Company BA
DMA (daily moving average) of Boeing Company BA
| DMA period | DMA value | | 5 day DMA | 197.06 | | 12 day DMA | 189 | | 20 day DMA | 191.27 | | 35 day DMA | 199.98 | | 50 day DMA | 205.06 | | 100 day DMA | 216.13 | | 150 day DMA | 212.88 | | 200 day DMA | 200.82 | EMA (exponential moving average) of Boeing Company BA
| EMA period | EMA current | EMA prev | EMA prev2 | | 5 day EMA | 197.83 | 195.79 | 192.41 | | 12 day EMA | 193.71 | 192.22 | 190.35 | | 20 day EMA | 194.49 | 193.71 | 192.78 | | 35 day EMA | 198.77 | 198.58 | 198.35 | | 50 day EMA | 205.14 | 205.27 | 205.38 |
SMA (simple moving average) of Boeing Company BA
| SMA period | SMA current | SMA prev | SMA prev2 | | 5 day SMA | 197.06 | 194.06 | 190.03 | | 12 day SMA | 189 | 188.16 | 187.49 | | 20 day SMA | 191.27 | 191.06 | 190.83 | | 35 day SMA | 199.98 | 200.32 | 200.66 | | 50 day SMA | 205.06 | 205.32 | 205.6 | | 100 day SMA | 216.13 | 216.41 | 216.69 | | 150 day SMA | 212.88 | 212.75 | 212.62 | | 200 day SMA | 200.82 | 200.75 | 200.66 |
|
|
