AxtInc AXTI full analysis,charts,indicators,moving averages,SMA,DMA,EMA,ADX,MACD,RSIAxt Inc AXTI WideScreen charts, DMA,SMA,EMA technical analysis, forecast prediction, by indicators ADX,MACD,RSI,CCI USA stock exchange
operates under Technology sector & deals in Semiconductors
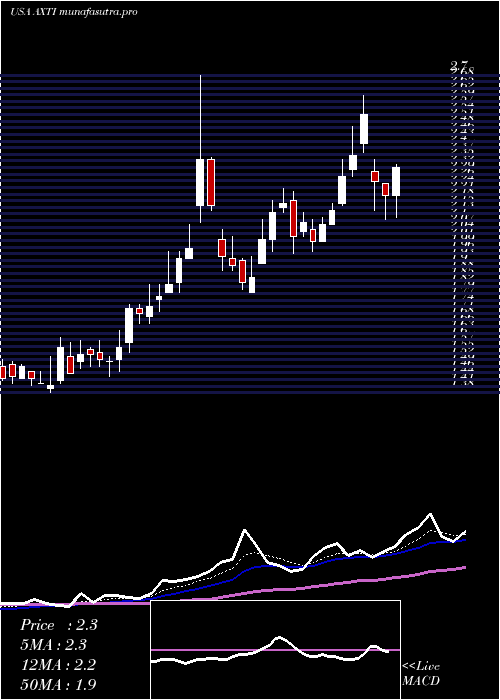
Daily price and charts and targets AxtInc Strong Daily Stock price targets for AxtInc AXTI are 4.64 and 5.18 | Daily Target 1 | 4.48 | | Daily Target 2 | 4.7 | | Daily Target 3 | 5.0233333333333 | | Daily Target 4 | 5.24 | | Daily Target 5 | 5.56 |
Daily price and volume Axt Inc
| Date |
Closing |
Open |
Range |
Volume |
Mon 20 October 2025 |
4.91 (8.87%) |
4.91 |
4.81 - 5.35 |
1.4402 times |
Fri 17 October 2025 |
4.51 (-7.39%) |
4.70 |
4.35 - 4.77 |
0.8757 times |
Thu 16 October 2025 |
4.87 (6.1%) |
4.81 |
4.45 - 4.98 |
0.9785 times |
Wed 15 October 2025 |
4.59 (0.44%) |
4.77 |
4.48 - 4.83 |
0.6665 times |
Tue 14 October 2025 |
4.57 (-0.65%) |
4.50 |
4.35 - 4.67 |
0.4836 times |
Mon 13 October 2025 |
4.60 (14.14%) |
4.47 |
4.45 - 4.78 |
1.4011 times |
Fri 10 October 2025 |
4.03 (-22.94%) |
5.28 |
4.00 - 5.29 |
2.1692 times |
Thu 09 October 2025 |
5.23 (-1.51%) |
5.36 |
5.03 - 5.45 |
0.4238 times |
Wed 08 October 2025 |
5.31 (0%) |
5.31 |
5.21 - 5.44 |
0.4194 times |
Tue 07 October 2025 |
5.31 (-1.48%) |
5.50 |
5.24 - 5.67 |
1.142 times |
Mon 06 October 2025 |
5.39 (5.27%) |
5.21 |
4.85 - 5.46 |
1.5991 times |
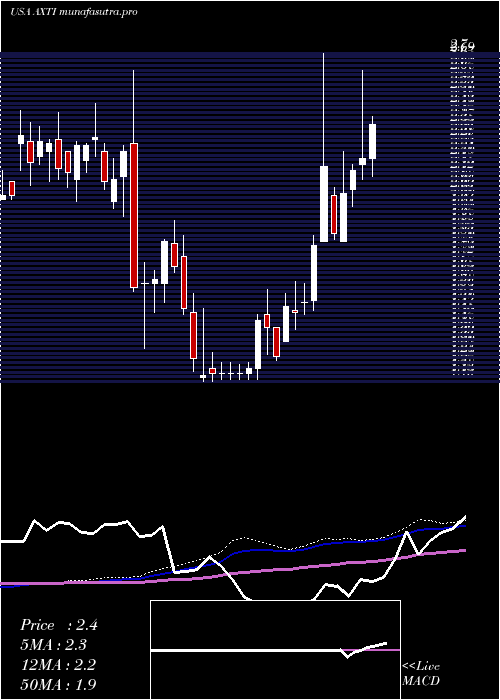
Weekly price and charts AxtInc Strong weekly Stock price targets for AxtInc AXTI are 4.64 and 5.18 | Weekly Target 1 | 4.48 | | Weekly Target 2 | 4.7 | | Weekly Target 3 | 5.0233333333333 | | Weekly Target 4 | 5.24 | | Weekly Target 5 | 5.56 |
Weekly price and volumes for Axt Inc
| Date |
Closing |
Open |
Range |
Volume |
Mon 20 October 2025 |
4.91 (8.87%) |
4.91 |
4.81 - 5.35 |
0.4157 times |
Fri 17 October 2025 |
4.51 (11.91%) |
4.47 |
4.35 - 4.98 |
1.2714 times |
Fri 10 October 2025 |
4.03 (-21.29%) |
5.21 |
4.00 - 5.67 |
1.6605 times |
Fri 03 October 2025 |
5.12 (9.87%) |
4.88 |
4.37 - 5.48 |
1.839 times |
Fri 26 September 2025 |
4.66 (7.37%) |
4.74 |
4.51 - 5.42 |
1.7879 times |
Fri 19 September 2025 |
4.34 (18.58%) |
3.70 |
3.70 - 4.46 |
1.1347 times |
Fri 12 September 2025 |
3.66 (17.68%) |
3.25 |
3.02 - 3.72 |
0.9715 times |
Fri 05 September 2025 |
3.11 (7.24%) |
2.83 |
2.83 - 3.29 |
0.4986 times |
Fri 29 August 2025 |
2.90 (0%) |
2.89 |
2.75 - 2.93 |
0.0527 times |
Fri 29 August 2025 |
2.90 (2.84%) |
2.80 |
2.68 - 2.95 |
0.3679 times |
Fri 22 August 2025 |
2.82 (37.56%) |
2.06 |
2.06 - 2.85 |
1.1458 times |
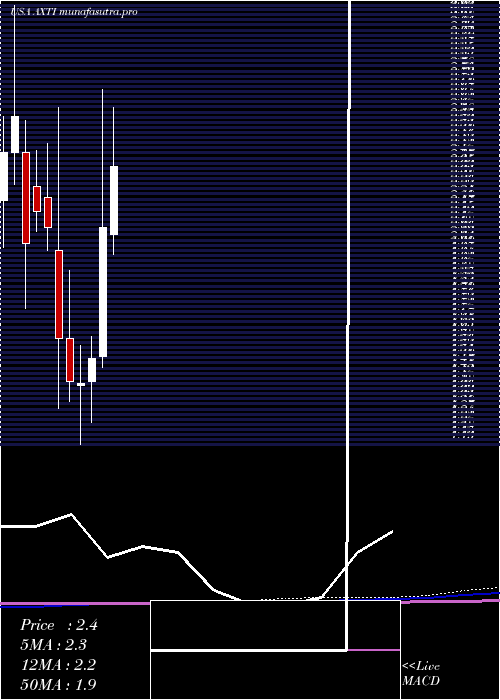
Monthly price and charts AxtInc Strong monthly Stock price targets for AxtInc AXTI are 4.46 and 6.13 | Monthly Target 1 | 3.19 | | Monthly Target 2 | 4.05 | | Monthly Target 3 | 4.86 | | Monthly Target 4 | 5.72 | | Monthly Target 5 | 6.53 |
Monthly price and volumes Axt Inc
| Date |
Closing |
Open |
Range |
Volume |
Mon 20 October 2025 |
4.91 (9.35%) |
4.49 |
4.00 - 5.67 |
1.8826 times |
Tue 30 September 2025 |
4.49 (54.83%) |
2.83 |
2.83 - 5.42 |
2.1917 times |
Fri 29 August 2025 |
2.90 (39.42%) |
2.00 |
1.85 - 2.95 |
0.8081 times |
Thu 31 July 2025 |
2.08 (-0.48%) |
2.06 |
1.97 - 2.62 |
0.678 times |
Mon 30 June 2025 |
2.09 (38.41%) |
1.52 |
1.47 - 2.70 |
0.9446 times |
Fri 30 May 2025 |
1.51 (7.86%) |
1.41 |
1.23 - 1.61 |
0.3699 times |
Wed 30 April 2025 |
1.40 (-0.71%) |
1.39 |
1.13 - 1.57 |
0.447 times |
Mon 31 March 2025 |
1.41 (-11.88%) |
1.60 |
1.32 - 1.90 |
0.621 times |
Fri 28 February 2025 |
1.60 (-23.44%) |
1.99 |
1.29 - 2.62 |
1.6807 times |
Fri 31 January 2025 |
2.09 (-3.24%) |
2.22 |
1.99 - 2.46 |
0.3764 times |
Tue 31 December 2024 |
2.16 (6.93%) |
2.27 |
2.07 - 2.43 |
0.3329 times |
DMA SMA EMA moving averages of Axt Inc AXTI
DMA (daily moving average) of Axt Inc AXTI
| DMA period | DMA value | | 5 day DMA | 4.69 | | 12 day DMA | 4.87 | | 20 day DMA | 4.83 | | 35 day DMA | 4.31 | | 50 day DMA | 3.78 | | 100 day DMA | 2.93 | | 150 day DMA | 2.42 | | 200 day DMA | 2.31 | EMA (exponential moving average) of Axt Inc AXTI
| EMA period | EMA current | EMA prev | EMA prev2 | | 5 day EMA | 4.74 | 4.66 | 4.73 | | 12 day EMA | 4.74 | 4.71 | 4.75 | | 20 day EMA | 4.61 | 4.58 | 4.59 | | 35 day EMA | 4.21 | 4.17 | 4.15 | | 50 day EMA | 3.73 | 3.68 | 3.65 |
SMA (simple moving average) of Axt Inc AXTI
| SMA period | SMA current | SMA prev | SMA prev2 | | 5 day SMA | 4.69 | 4.63 | 4.53 | | 12 day SMA | 4.87 | 4.86 | 4.89 | | 20 day SMA | 4.83 | 4.84 | 4.83 | | 35 day SMA | 4.31 | 4.25 | 4.21 | | 50 day SMA | 3.78 | 3.72 | 3.67 | | 100 day SMA | 2.93 | 2.9 | 2.87 | | 150 day SMA | 2.42 | 2.4 | 2.38 | | 200 day SMA | 2.31 | 2.29 | 2.28 |
|
|
