AvnetInc AVT full analysis,charts,indicators,moving averages,SMA,DMA,EMA,ADX,MACD,RSIAvnet Inc AVT WideScreen charts, DMA,SMA,EMA technical analysis, forecast prediction, by indicators ADX,MACD,RSI,CCI USA stock exchange
operates under Consumer Non Durables sector & deals in Electronic Components
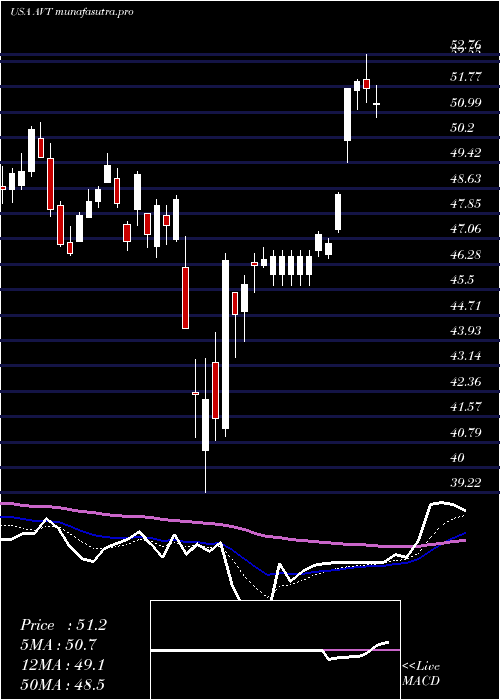
Daily price and charts and targets AvnetInc Strong Daily Stock price targets for AvnetInc AVT are 51.25 and 52.78 | Daily Target 1 | 50.95 | | Daily Target 2 | 51.55 | | Daily Target 3 | 52.48 | | Daily Target 4 | 53.08 | | Daily Target 5 | 54.01 |
Daily price and volume Avnet Inc
| Date |
Closing |
Open |
Range |
Volume |
Tue 21 October 2025 |
52.15 (-1.73%) |
53.07 |
51.88 - 53.41 |
0.9113 times |
Mon 20 October 2025 |
53.07 (1.9%) |
52.24 |
52.14 - 53.40 |
1.0002 times |
Fri 17 October 2025 |
52.08 (-0.63%) |
52.34 |
51.68 - 52.59 |
0.8836 times |
Thu 16 October 2025 |
52.41 (-0.15%) |
52.54 |
52.13 - 52.76 |
0.8501 times |
Wed 15 October 2025 |
52.49 (1.88%) |
52.04 |
51.57 - 52.56 |
0.8657 times |
Tue 14 October 2025 |
51.52 (1.64%) |
49.90 |
49.69 - 52.02 |
1.6228 times |
Mon 13 October 2025 |
50.69 (2.36%) |
50.52 |
50.13 - 51.14 |
1.0385 times |
Fri 10 October 2025 |
49.52 (-2.79%) |
51.01 |
49.38 - 51.26 |
1.0963 times |
Thu 09 October 2025 |
50.94 (-1.55%) |
51.85 |
50.52 - 52.19 |
1.0248 times |
Wed 08 October 2025 |
51.74 (0.78%) |
51.38 |
51.29 - 52.14 |
0.7067 times |
Tue 07 October 2025 |
51.34 (-2%) |
52.71 |
51.26 - 52.99 |
0.7356 times |
Weekly price and charts AvnetInc Strong weekly Stock price targets for AvnetInc AVT are 51.25 and 52.78 | Weekly Target 1 | 50.95 | | Weekly Target 2 | 51.55 | | Weekly Target 3 | 52.48 | | Weekly Target 4 | 53.08 | | Weekly Target 5 | 54.01 |
Weekly price and volumes for Avnet Inc
| Date |
Closing |
Open |
Range |
Volume |
Tue 21 October 2025 |
52.15 (0.13%) |
52.24 |
51.88 - 53.41 |
0.3962 times |
Fri 17 October 2025 |
52.08 (5.17%) |
50.52 |
49.69 - 52.76 |
1.0905 times |
Fri 10 October 2025 |
49.52 (-4.51%) |
52.44 |
49.38 - 52.99 |
0.8861 times |
Fri 03 October 2025 |
51.86 (-0.15%) |
52.08 |
51.28 - 52.76 |
0.6769 times |
Fri 26 September 2025 |
51.94 (-2.15%) |
53.17 |
51.20 - 54.13 |
0.7366 times |
Fri 19 September 2025 |
53.08 (-0.69%) |
53.62 |
51.90 - 54.15 |
1.5084 times |
Fri 12 September 2025 |
53.45 (-0.6%) |
53.52 |
52.51 - 54.47 |
1.0235 times |
Fri 05 September 2025 |
53.77 (-1.47%) |
52.49 |
51.60 - 54.15 |
2.7116 times |
Fri 29 August 2025 |
54.57 (0%) |
54.81 |
54.28 - 55.21 |
0.1552 times |
Fri 29 August 2025 |
54.57 (-1.96%) |
55.66 |
54.17 - 55.85 |
0.8149 times |
Fri 22 August 2025 |
55.66 (4.1%) |
53.08 |
52.51 - 55.92 |
0.7051 times |
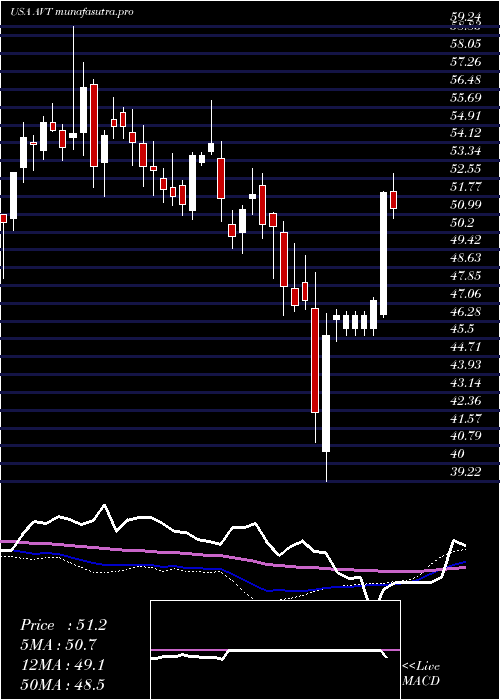
Monthly price and charts AvnetInc Strong monthly Stock price targets for AvnetInc AVT are 48.75 and 52.78 | Monthly Target 1 | 47.62 | | Monthly Target 2 | 49.88 | | Monthly Target 3 | 51.646666666667 | | Monthly Target 4 | 53.91 | | Monthly Target 5 | 55.68 |
Monthly price and volumes Avnet Inc
| Date |
Closing |
Open |
Range |
Volume |
Tue 21 October 2025 |
52.15 (-0.25%) |
52.24 |
49.38 - 53.41 |
0.6463 times |
Tue 30 September 2025 |
52.28 (-4.2%) |
52.49 |
51.20 - 54.47 |
1.4418 times |
Fri 29 August 2025 |
54.57 (3.08%) |
52.15 |
45.67 - 55.92 |
0.9599 times |
Thu 31 July 2025 |
52.94 (-0.26%) |
52.99 |
52.59 - 57.24 |
0.9764 times |
Mon 30 June 2025 |
53.08 (6.14%) |
49.89 |
49.22 - 53.14 |
0.7108 times |
Fri 30 May 2025 |
50.01 (6.43%) |
47.31 |
47.05 - 52.96 |
0.868 times |
Wed 30 April 2025 |
46.99 (-2.29%) |
47.80 |
39.22 - 52.76 |
1.3373 times |
Mon 31 March 2025 |
48.09 (-4.85%) |
51.01 |
46.48 - 51.06 |
1.365 times |
Fri 28 February 2025 |
50.54 (-2.17%) |
50.52 |
49.25 - 53.01 |
0.8297 times |
Fri 31 January 2025 |
51.66 (-1.2%) |
52.55 |
50.67 - 56.00 |
0.8646 times |
Tue 31 December 2024 |
52.29 (-4.65%) |
54.57 |
51.48 - 55.60 |
1.0073 times |

DMA SMA EMA moving averages of Avnet Inc AVT
DMA (daily moving average) of Avnet Inc AVT
| DMA period | DMA value | | 5 day DMA | 52.44 | | 12 day DMA | 51.7 | | 20 day DMA | 51.84 | | 35 day DMA | 52.48 | | 50 day DMA | 52.98 | | 100 day DMA | 53 | | 150 day DMA | 51.49 | | 200 day DMA | 51.39 | EMA (exponential moving average) of Avnet Inc AVT
| EMA period | EMA current | EMA prev | EMA prev2 | | 5 day EMA | 52.25 | 52.3 | 51.91 | | 12 day EMA | 52.01 | 51.98 | 51.78 | | 20 day EMA | 52.08 | 52.07 | 51.97 | | 35 day EMA | 52.35 | 52.36 | 52.32 | | 50 day EMA | 52.8 | 52.83 | 52.82 |
SMA (simple moving average) of Avnet Inc AVT
| SMA period | SMA current | SMA prev | SMA prev2 | | 5 day SMA | 52.44 | 52.31 | 51.84 | | 12 day SMA | 51.7 | 51.67 | 51.58 | | 20 day SMA | 51.84 | 51.88 | 51.9 | | 35 day SMA | 52.48 | 52.48 | 52.52 | | 50 day SMA | 52.98 | 53 | 52.97 | | 100 day SMA | 53 | 52.98 | 52.96 | | 150 day SMA | 51.49 | 51.46 | 51.43 | | 200 day SMA | 51.39 | 51.39 | 51.39 |
|
|
