AdventClaymore AVK full analysis,charts,indicators,moving averages,SMA,DMA,EMA,ADX,MACD,RSIAdvent Claymore AVK WideScreen charts, DMA,SMA,EMA technical analysis, forecast prediction, by indicators ADX,MACD,RSI,CCI USA stock exchange
operates under N A sector & deals in N A
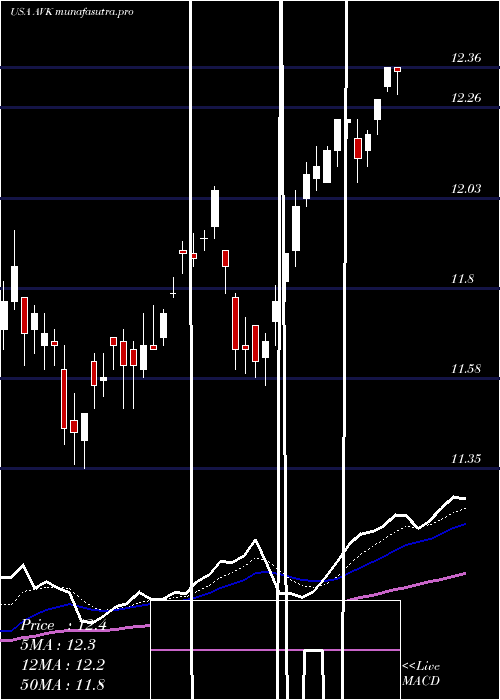
Daily price and charts and targets AdventClaymore Strong Daily Stock price targets for AdventClaymore AVK are 12.63 and 12.75 | Daily Target 1 | 12.53 | | Daily Target 2 | 12.61 | | Daily Target 3 | 12.65 | | Daily Target 4 | 12.73 | | Daily Target 5 | 12.77 |
Daily price and volume Advent Claymore
| Date |
Closing |
Open |
Range |
Volume |
Thu 04 December 2025 |
12.69 (1.12%) |
12.62 |
12.57 - 12.69 |
0.671 times |
Wed 03 December 2025 |
12.55 (0.32%) |
12.47 |
12.47 - 12.63 |
0.612 times |
Tue 02 December 2025 |
12.51 (-1.03%) |
12.70 |
12.51 - 12.71 |
1.1717 times |
Mon 01 December 2025 |
12.64 (-0.24%) |
12.68 |
12.56 - 12.70 |
0.9189 times |
Fri 28 November 2025 |
12.67 (0.96%) |
12.62 |
12.56 - 12.68 |
0.9773 times |
Wed 26 November 2025 |
12.55 (1.46%) |
12.41 |
12.40 - 12.55 |
0.9978 times |
Tue 25 November 2025 |
12.37 (0.65%) |
12.34 |
12.25 - 12.39 |
1.091 times |
Mon 24 November 2025 |
12.29 (1.24%) |
12.15 |
12.05 - 12.30 |
1.5929 times |
Fri 21 November 2025 |
12.14 (0.91%) |
12.04 |
12.00 - 12.24 |
0.776 times |
Thu 20 November 2025 |
12.03 (-1.55%) |
12.30 |
12.02 - 12.30 |
1.1916 times |
Wed 19 November 2025 |
12.22 (-0.73%) |
12.33 |
12.15 - 12.33 |
1.1108 times |
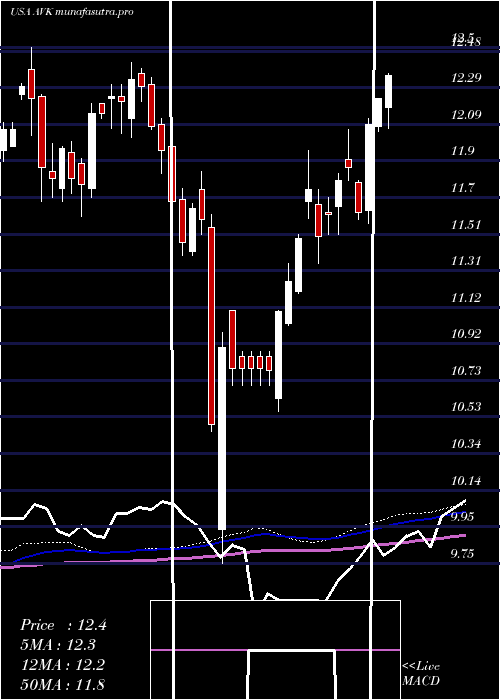
Weekly price and charts AdventClaymore Strong weekly Stock price targets for AdventClaymore AVK are 12.58 and 12.82 | Weekly Target 1 | 12.38 | | Weekly Target 2 | 12.54 | | Weekly Target 3 | 12.623333333333 | | Weekly Target 4 | 12.78 | | Weekly Target 5 | 12.86 |
Weekly price and volumes for Advent Claymore
| Date |
Closing |
Open |
Range |
Volume |
Thu 04 December 2025 |
12.69 (0.16%) |
12.68 |
12.47 - 12.71 |
0.7687 times |
Fri 28 November 2025 |
12.67 (4.37%) |
12.15 |
12.05 - 12.68 |
1.0616 times |
Fri 21 November 2025 |
12.14 (-2.72%) |
12.42 |
12.00 - 12.42 |
1.1751 times |
Fri 14 November 2025 |
12.48 (-1.58%) |
12.76 |
12.39 - 12.92 |
1.1989 times |
Fri 07 November 2025 |
12.68 (-2.39%) |
12.94 |
12.62 - 12.94 |
0.7043 times |
Fri 31 October 2025 |
12.99 (0%) |
12.95 |
12.87 - 13.03 |
0.203 times |
Fri 31 October 2025 |
12.99 (1.88%) |
12.84 |
12.80 - 13.06 |
1.2074 times |
Fri 24 October 2025 |
12.75 (0.87%) |
12.70 |
12.51 - 12.85 |
1.2859 times |
Fri 17 October 2025 |
12.64 (-1.33%) |
12.95 |
12.57 - 13.04 |
1.0606 times |
Fri 10 October 2025 |
12.81 (0%) |
12.77 |
12.74 - 13.10 |
1.3347 times |
Fri 03 October 2025 |
12.81 (1.34%) |
12.70 |
12.66 - 12.87 |
1.2003 times |
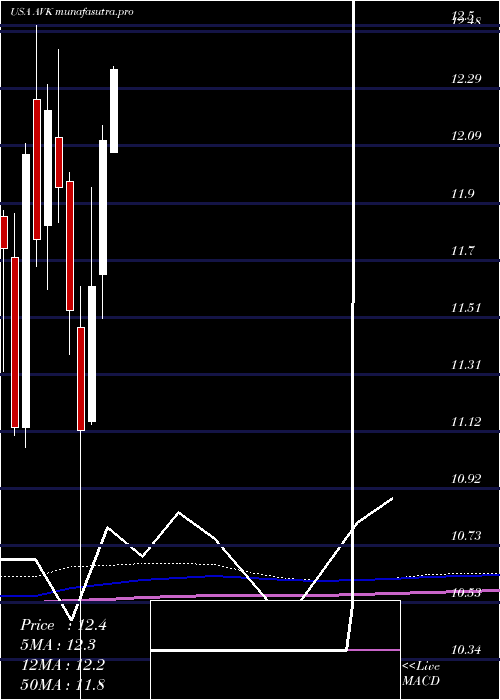
Monthly price and charts AdventClaymore Strong monthly Stock price targets for AdventClaymore AVK are 12.58 and 12.82 | Monthly Target 1 | 12.38 | | Monthly Target 2 | 12.54 | | Monthly Target 3 | 12.623333333333 | | Monthly Target 4 | 12.78 | | Monthly Target 5 | 12.86 |
Monthly price and volumes Advent Claymore
| Date |
Closing |
Open |
Range |
Volume |
Thu 04 December 2025 |
12.69 (0.16%) |
12.68 |
12.47 - 12.71 |
0.188 times |
Fri 28 November 2025 |
12.67 (-2.46%) |
12.94 |
12.00 - 12.94 |
1.0123 times |
Fri 31 October 2025 |
12.99 (1.56%) |
12.79 |
12.51 - 13.10 |
1.4247 times |
Tue 30 September 2025 |
12.79 (2.73%) |
12.44 |
12.40 - 12.80 |
1.1018 times |
Fri 29 August 2025 |
12.45 (1.22%) |
12.24 |
12.05 - 12.57 |
1.0495 times |
Thu 31 July 2025 |
12.30 (1.57%) |
12.07 |
11.94 - 12.37 |
1.1895 times |
Mon 30 June 2025 |
12.11 (4.31%) |
11.65 |
11.50 - 12.16 |
0.9234 times |
Fri 30 May 2025 |
11.61 (4.41%) |
11.15 |
11.14 - 11.95 |
0.9126 times |
Wed 30 April 2025 |
11.12 (-3.56%) |
11.47 |
9.75 - 11.61 |
1.2716 times |
Mon 31 March 2025 |
11.53 (-3.51%) |
11.97 |
11.38 - 12.00 |
0.9267 times |
Fri 28 February 2025 |
11.95 (-2.13%) |
12.12 |
11.83 - 12.42 |
0.8827 times |
DMA SMA EMA moving averages of Advent Claymore AVK
DMA (daily moving average) of Advent Claymore AVK
| DMA period | DMA value | | 5 day DMA | 12.61 | | 12 day DMA | 12.41 | | 20 day DMA | 12.52 | | 35 day DMA | 12.65 | | 50 day DMA | 12.7 | | 100 day DMA | 12.56 | | 150 day DMA | 12.3 | | 200 day DMA | 12.05 | EMA (exponential moving average) of Advent Claymore AVK
| EMA period | EMA current | EMA prev | EMA prev2 | | 5 day EMA | 12.58 | 12.53 | 12.52 | | 12 day EMA | 12.53 | 12.5 | 12.49 | | 20 day EMA | 12.55 | 12.54 | 12.54 | | 35 day EMA | 12.6 | 12.59 | 12.59 | | 50 day EMA | 12.7 | 12.7 | 12.71 |
SMA (simple moving average) of Advent Claymore AVK
| SMA period | SMA current | SMA prev | SMA prev2 | | 5 day SMA | 12.61 | 12.58 | 12.55 | | 12 day SMA | 12.41 | 12.38 | 12.37 | | 20 day SMA | 12.52 | 12.53 | 12.54 | | 35 day SMA | 12.65 | 12.66 | 12.67 | | 50 day SMA | 12.7 | 12.7 | 12.71 | | 100 day SMA | 12.56 | 12.56 | 12.55 | | 150 day SMA | 12.3 | 12.29 | 12.28 | | 200 day SMA | 12.05 | 12.05 | 12.05 |
|
|
