AtricureInc ATRC full analysis,charts,indicators,moving averages,SMA,DMA,EMA,ADX,MACD,RSIAtricure Inc ATRC WideScreen charts, DMA,SMA,EMA technical analysis, forecast prediction, by indicators ADX,MACD,RSI,CCI USA stock exchange
operates under Health Care sector & deals in Medical Dental Instruments
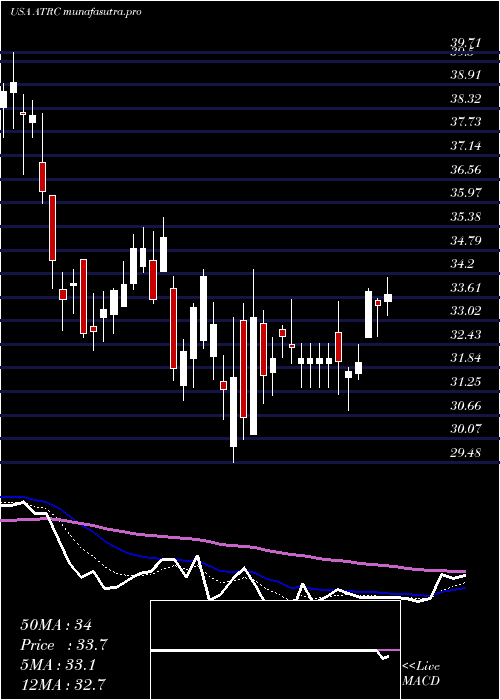
Daily price and charts and targets AtricureInc Strong Daily Stock price targets for AtricureInc ATRC are 39.45 and 41.54 | Daily Target 1 | 37.91 | | Daily Target 2 | 38.89 | | Daily Target 3 | 40.003333333333 | | Daily Target 4 | 40.98 | | Daily Target 5 | 42.09 |
Daily price and volume Atricure Inc
| Date |
Closing |
Open |
Range |
Volume |
Fri 05 December 2025 |
39.86 (1.55%) |
39.26 |
39.03 - 41.12 |
1.0881 times |
Thu 04 December 2025 |
39.25 (8.1%) |
36.38 |
36.38 - 39.73 |
1.6588 times |
Wed 03 December 2025 |
36.31 (2.83%) |
35.31 |
34.99 - 36.32 |
0.8842 times |
Tue 02 December 2025 |
35.31 (0.63%) |
35.47 |
34.88 - 36.19 |
1.2941 times |
Mon 01 December 2025 |
35.09 (-2.85%) |
35.10 |
34.94 - 35.86 |
0.8581 times |
Fri 28 November 2025 |
36.12 (0.25%) |
36.00 |
35.58 - 36.51 |
0.5378 times |
Wed 26 November 2025 |
36.03 (-6.37%) |
38.35 |
35.51 - 38.90 |
1.1188 times |
Tue 25 November 2025 |
38.48 (1.96%) |
37.16 |
37.16 - 38.61 |
0.7652 times |
Mon 24 November 2025 |
37.74 (4.34%) |
36.49 |
36.17 - 38.00 |
0.851 times |
Fri 21 November 2025 |
36.17 (8.78%) |
33.31 |
33.29 - 36.37 |
0.9438 times |
Thu 20 November 2025 |
33.25 (-2.72%) |
34.77 |
33.20 - 35.16 |
0.5874 times |
Weekly price and charts AtricureInc Strong weekly Stock price targets for AtricureInc ATRC are 37.37 and 43.61 | Weekly Target 1 | 32.38 | | Weekly Target 2 | 36.12 | | Weekly Target 3 | 38.62 | | Weekly Target 4 | 42.36 | | Weekly Target 5 | 44.86 |
Weekly price and volumes for Atricure Inc
| Date |
Closing |
Open |
Range |
Volume |
Fri 05 December 2025 |
39.86 (10.35%) |
35.10 |
34.88 - 41.12 |
1.4692 times |
Fri 28 November 2025 |
36.12 (-0.14%) |
36.49 |
35.51 - 38.90 |
0.8315 times |
Fri 21 November 2025 |
36.17 (9.94%) |
32.60 |
32.14 - 36.37 |
1.1471 times |
Fri 14 November 2025 |
32.90 (2.65%) |
32.17 |
31.12 - 34.38 |
1.0066 times |
Fri 07 November 2025 |
32.05 (-7.24%) |
33.83 |
31.10 - 34.60 |
0.9544 times |
Fri 31 October 2025 |
34.55 (0%) |
34.19 |
33.76 - 35.13 |
0.3067 times |
Fri 31 October 2025 |
34.55 (-7.96%) |
37.93 |
30.94 - 38.42 |
2.0617 times |
Fri 24 October 2025 |
37.54 (1.02%) |
37.61 |
36.61 - 38.11 |
0.6885 times |
Fri 17 October 2025 |
37.16 (2.71%) |
36.46 |
35.03 - 37.83 |
0.8112 times |
Fri 10 October 2025 |
36.18 (3.94%) |
34.98 |
33.74 - 37.31 |
0.7232 times |
Fri 03 October 2025 |
34.81 (-1.11%) |
35.34 |
33.45 - 35.76 |
0.619 times |
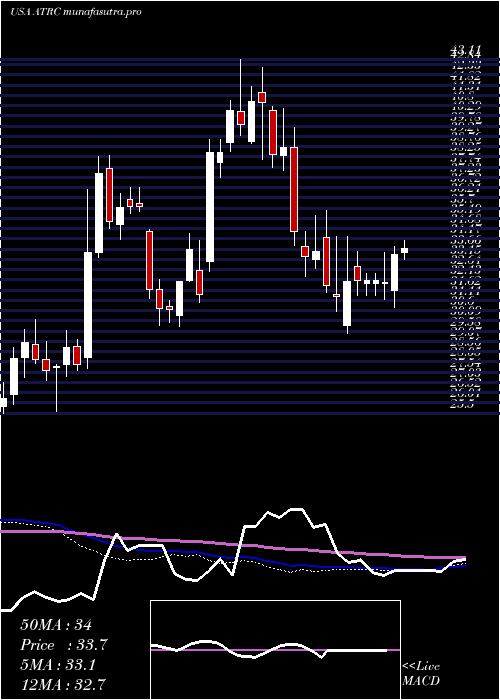
Monthly price and charts AtricureInc Strong monthly Stock price targets for AtricureInc ATRC are 37.37 and 43.61 | Monthly Target 1 | 32.38 | | Monthly Target 2 | 36.12 | | Monthly Target 3 | 38.62 | | Monthly Target 4 | 42.36 | | Monthly Target 5 | 44.86 |
Monthly price and volumes Atricure Inc
| Date |
Closing |
Open |
Range |
Volume |
Fri 05 December 2025 |
39.86 (10.35%) |
35.10 |
34.88 - 41.12 |
0.3446 times |
Fri 28 November 2025 |
36.12 (4.54%) |
33.83 |
31.10 - 38.90 |
0.9239 times |
Fri 31 October 2025 |
34.55 (-1.99%) |
34.89 |
30.94 - 38.42 |
1.1581 times |
Tue 30 September 2025 |
35.25 (-4.7%) |
36.26 |
34.21 - 38.33 |
0.9027 times |
Fri 29 August 2025 |
36.99 (5.38%) |
35.01 |
33.63 - 38.33 |
0.9276 times |
Thu 31 July 2025 |
35.10 (7.11%) |
32.59 |
28.96 - 38.11 |
1.2762 times |
Mon 30 June 2025 |
32.77 (-5.21%) |
34.35 |
30.98 - 35.33 |
0.8916 times |
Fri 30 May 2025 |
34.57 (15.58%) |
29.92 |
28.29 - 34.76 |
1.2796 times |
Wed 30 April 2025 |
29.91 (-7.28%) |
32.08 |
28.64 - 35.60 |
1.2312 times |
Mon 31 March 2025 |
32.26 (-16.73%) |
38.71 |
31.02 - 39.71 |
1.0647 times |
Fri 28 February 2025 |
38.74 (-2.83%) |
39.01 |
37.60 - 42.68 |
1.0282 times |

DMA SMA EMA moving averages of Atricure Inc ATRC
DMA (daily moving average) of Atricure Inc ATRC
| DMA period | DMA value | | 5 day DMA | 37.16 | | 12 day DMA | 36.48 | | 20 day DMA | 34.93 | | 35 day DMA | 35.15 | | 50 day DMA | 35.22 | | 100 day DMA | 35.16 | | 150 day DMA | 34.22 | | 200 day DMA | 34.21 | EMA (exponential moving average) of Atricure Inc ATRC
| EMA period | EMA current | EMA prev | EMA prev2 | | 5 day EMA | 37.96 | 37.01 | 35.89 | | 12 day EMA | 36.62 | 36.03 | 35.44 | | 20 day EMA | 35.92 | 35.5 | 35.11 | | 35 day EMA | 35.58 | 35.33 | 35.1 | | 50 day EMA | 35.54 | 35.36 | 35.2 |
SMA (simple moving average) of Atricure Inc ATRC
| SMA period | SMA current | SMA prev | SMA prev2 | | 5 day SMA | 37.16 | 36.42 | 35.77 | | 12 day SMA | 36.48 | 35.92 | 35.41 | | 20 day SMA | 34.93 | 34.51 | 34.17 | | 35 day SMA | 35.15 | 35.08 | 35.02 | | 50 day SMA | 35.22 | 35.12 | 35.06 | | 100 day SMA | 35.16 | 35.06 | 34.98 | | 150 day SMA | 34.22 | 34.15 | 34.09 | | 200 day SMA | 34.21 | 34.2 | 34.21 |
|
|
