AtaraBiotherapeutics ATRA full analysis,charts,indicators,moving averages,SMA,DMA,EMA,ADX,MACD,RSIAtara Biotherapeutics ATRA WideScreen charts, DMA,SMA,EMA technical analysis, forecast prediction, by indicators ADX,MACD,RSI,CCI USA stock exchange
operates under Health Care sector & deals in Biotechnology Biological Products No Diagnostic Substances
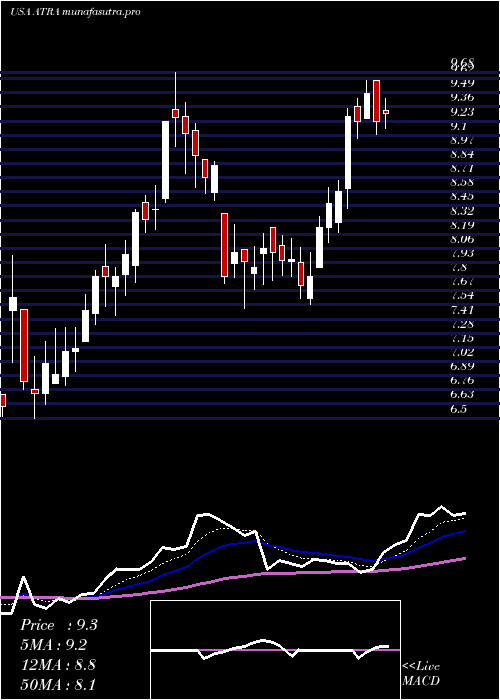
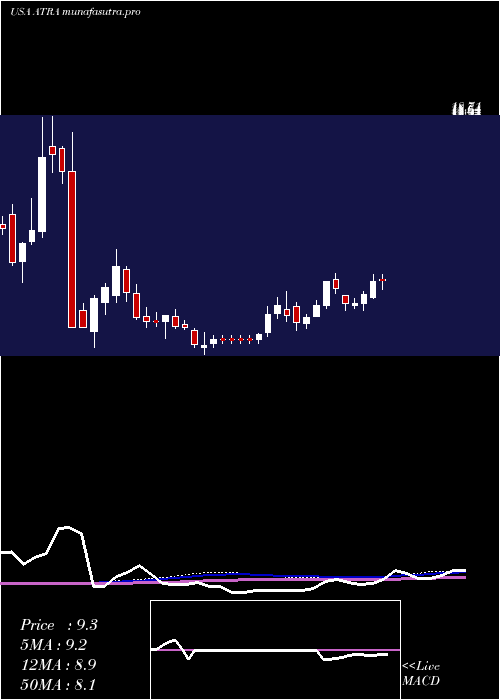
Daily price and charts and targets AtaraBiotherapeutics Strong Daily Stock price targets for AtaraBiotherapeutics ATRA are 14.84 and 15.97 | Daily Target 1 | 14.52 | | Daily Target 2 | 15.16 | | Daily Target 3 | 15.653333333333 | | Daily Target 4 | 16.29 | | Daily Target 5 | 16.78 |
Daily price and volume Atara Biotherapeutics
| Date |
Closing |
Open |
Range |
Volume |
Tue 21 October 2025 |
15.79 (-1.56%) |
16.04 |
15.02 - 16.15 |
0.9161 times |
Mon 20 October 2025 |
16.04 (8.31%) |
15.08 |
14.95 - 16.09 |
1.2661 times |
Fri 17 October 2025 |
14.81 (-2.82%) |
15.09 |
14.58 - 15.42 |
0.553 times |
Thu 16 October 2025 |
15.24 (-0.26%) |
15.42 |
14.92 - 16.28 |
0.7775 times |
Wed 15 October 2025 |
15.28 (4.59%) |
15.09 |
14.61 - 15.45 |
0.5645 times |
Tue 14 October 2025 |
14.61 (-2.86%) |
14.63 |
14.00 - 14.85 |
0.8419 times |
Mon 13 October 2025 |
15.04 (4.95%) |
14.62 |
14.30 - 15.35 |
1.0961 times |
Fri 10 October 2025 |
14.33 (-10.88%) |
16.28 |
14.03 - 16.28 |
1.5104 times |
Thu 09 October 2025 |
16.08 (1.45%) |
16.00 |
15.85 - 16.72 |
1.3255 times |
Wed 08 October 2025 |
15.85 (1.41%) |
15.76 |
14.85 - 15.97 |
1.1489 times |
Tue 07 October 2025 |
15.63 (14%) |
14.00 |
13.89 - 15.90 |
1.9066 times |
Weekly price and charts AtaraBiotherapeutics Strong weekly Stock price targets for AtaraBiotherapeutics ATRA are 15.37 and 16.57 | Weekly Target 1 | 14.43 | | Weekly Target 2 | 15.11 | | Weekly Target 3 | 15.63 | | Weekly Target 4 | 16.31 | | Weekly Target 5 | 16.83 |
Weekly price and volumes for Atara Biotherapeutics
| Date |
Closing |
Open |
Range |
Volume |
Tue 21 October 2025 |
15.79 (6.62%) |
15.08 |
14.95 - 16.15 |
0.5758 times |
Fri 17 October 2025 |
14.81 (3.35%) |
14.62 |
14.00 - 16.28 |
1.0114 times |
Fri 10 October 2025 |
14.33 (-0.56%) |
14.75 |
13.71 - 16.72 |
1.7097 times |
Fri 03 October 2025 |
14.41 (4.88%) |
13.55 |
13.12 - 14.85 |
1.0985 times |
Fri 26 September 2025 |
13.74 (14.02%) |
12.00 |
11.67 - 14.91 |
1.6621 times |
Fri 19 September 2025 |
12.05 (-0.58%) |
12.39 |
11.33 - 12.50 |
0.7723 times |
Fri 12 September 2025 |
12.12 (-6.12%) |
12.75 |
11.70 - 12.75 |
0.9705 times |
Fri 05 September 2025 |
12.91 (7.14%) |
11.97 |
11.81 - 13.20 |
0.9125 times |
Fri 29 August 2025 |
12.05 (0%) |
12.44 |
11.70 - 12.44 |
0.1594 times |
Fri 29 August 2025 |
12.05 (-2.35%) |
12.37 |
11.70 - 13.08 |
1.1277 times |
Fri 22 August 2025 |
12.34 (0.41%) |
12.21 |
11.20 - 12.50 |
1.3045 times |
Monthly price and charts AtaraBiotherapeutics Strong monthly Stock price targets for AtaraBiotherapeutics ATRA are 14.75 and 17.76 | Monthly Target 1 | 12.4 | | Monthly Target 2 | 14.09 | | Monthly Target 3 | 15.406666666667 | | Monthly Target 4 | 17.1 | | Monthly Target 5 | 18.42 |
Monthly price and volumes Atara Biotherapeutics
| Date |
Closing |
Open |
Range |
Volume |
Tue 21 October 2025 |
15.79 (10.19%) |
14.29 |
13.71 - 16.72 |
0.4173 times |
Tue 30 September 2025 |
14.33 (18.92%) |
11.97 |
11.33 - 14.91 |
0.537 times |
Fri 29 August 2025 |
12.05 (4.6%) |
11.40 |
10.32 - 13.08 |
0.5132 times |
Thu 31 July 2025 |
11.52 (49.22%) |
7.60 |
7.54 - 13.46 |
0.6576 times |
Mon 30 June 2025 |
7.72 (-1.03%) |
7.82 |
7.51 - 9.68 |
0.4453 times |
Fri 30 May 2025 |
7.80 (-2.38%) |
8.01 |
6.39 - 8.65 |
0.7515 times |
Wed 30 April 2025 |
7.99 (34.51%) |
6.18 |
5.01 - 8.01 |
0.4568 times |
Mon 31 March 2025 |
5.94 (-14.04%) |
6.92 |
5.85 - 7.60 |
0.5052 times |
Fri 28 February 2025 |
6.91 (-22.18%) |
8.43 |
6.55 - 11.06 |
0.9458 times |
Fri 31 January 2025 |
8.88 (-33.28%) |
13.34 |
5.40 - 18.71 |
4.7702 times |
Tue 31 December 2024 |
13.31 (8.56%) |
13.10 |
9.13 - 13.98 |
0.6962 times |
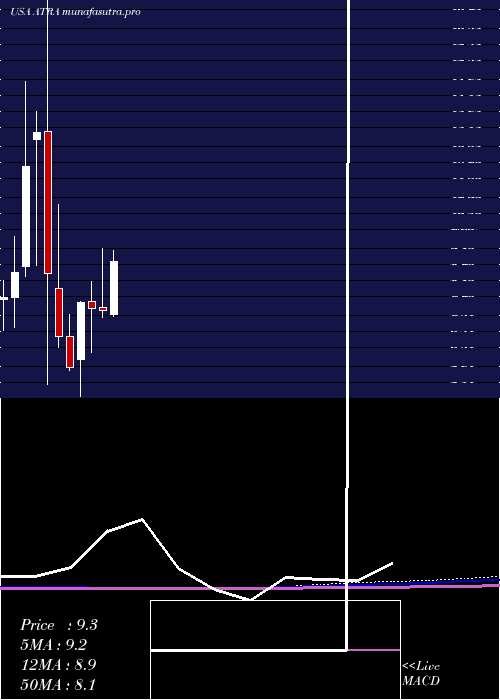
DMA SMA EMA moving averages of Atara Biotherapeutics ATRA
DMA (daily moving average) of Atara Biotherapeutics ATRA
| DMA period | DMA value | | 5 day DMA | 15.43 | | 12 day DMA | 15.2 | | 20 day DMA | 14.77 | | 35 day DMA | 13.67 | | 50 day DMA | 13.18 | | 100 day DMA | 11.37 | | 150 day DMA | 9.79 | | 200 day DMA | 9.53 | EMA (exponential moving average) of Atara Biotherapeutics ATRA
| EMA period | EMA current | EMA prev | EMA prev2 | | 5 day EMA | 15.5 | 15.35 | 15 | | 12 day EMA | 15.1 | 14.97 | 14.78 | | 20 day EMA | 14.66 | 14.54 | 14.38 | | 35 day EMA | 14.01 | 13.9 | 13.77 | | 50 day EMA | 13.22 | 13.12 | 13 |
SMA (simple moving average) of Atara Biotherapeutics ATRA
| SMA period | SMA current | SMA prev | SMA prev2 | | 5 day SMA | 15.43 | 15.2 | 15 | | 12 day SMA | 15.2 | 15.09 | 14.93 | | 20 day SMA | 14.77 | 14.63 | 14.44 | | 35 day SMA | 13.67 | 13.57 | 13.46 | | 50 day SMA | 13.18 | 13.1 | 12.98 | | 100 day SMA | 11.37 | 11.29 | 11.2 | | 150 day SMA | 9.79 | 9.73 | 9.67 | | 200 day SMA | 9.53 | 9.54 | 9.55 |
|
|
