AtossaGenetics ATOS full analysis,charts,indicators,moving averages,SMA,DMA,EMA,ADX,MACD,RSIAtossa Genetics ATOS WideScreen charts, DMA,SMA,EMA technical analysis, forecast prediction, by indicators ADX,MACD,RSI,CCI USA stock exchange
operates under Health Care sector & deals in Major Pharmaceuticals
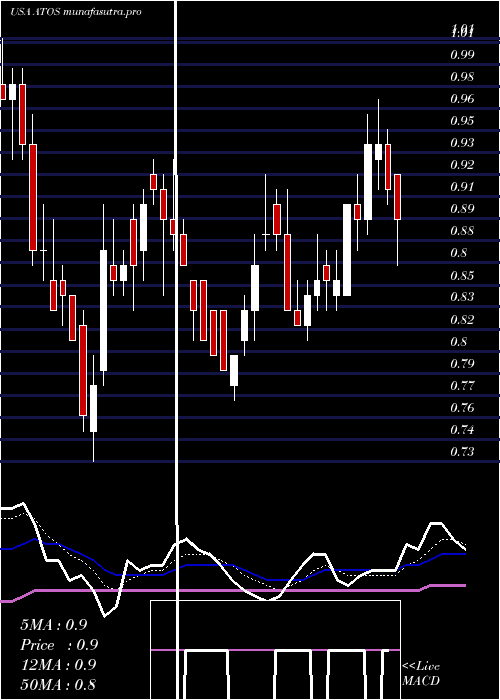
Daily price and charts and targets AtossaGenetics Strong Daily Stock price targets for AtossaGenetics ATOS are 1 and 1.04 | Daily Target 1 | 0.96 | | Daily Target 2 | 0.99 | | Daily Target 3 | 1.0033333333333 | | Daily Target 4 | 1.03 | | Daily Target 5 | 1.04 |
Daily price and volume Atossa Genetics
| Date |
Closing |
Open |
Range |
Volume |
Mon 20 October 2025 |
1.01 (3.06%) |
0.99 |
0.98 - 1.02 |
0.3063 times |
Fri 17 October 2025 |
0.98 (-2.97%) |
1.01 |
0.95 - 1.03 |
0.6449 times |
Thu 16 October 2025 |
1.01 (-3.81%) |
1.05 |
1.00 - 1.10 |
0.5523 times |
Wed 15 October 2025 |
1.05 (1.94%) |
1.04 |
1.03 - 1.08 |
0.4367 times |
Tue 14 October 2025 |
1.03 (-1.9%) |
1.02 |
0.96 - 1.06 |
0.8175 times |
Mon 13 October 2025 |
1.05 (-2.78%) |
1.12 |
1.04 - 1.15 |
0.8277 times |
Fri 10 October 2025 |
1.08 (-8.47%) |
1.17 |
1.05 - 1.20 |
1.2989 times |
Thu 09 October 2025 |
1.18 (6.31%) |
1.13 |
1.12 - 1.29 |
2.3334 times |
Wed 08 October 2025 |
1.11 (9.9%) |
1.01 |
1.01 - 1.16 |
2.2049 times |
Tue 07 October 2025 |
1.01 (0%) |
1.00 |
0.98 - 1.02 |
0.5775 times |
Mon 06 October 2025 |
1.01 (0%) |
1.01 |
0.97 - 1.04 |
0.6735 times |
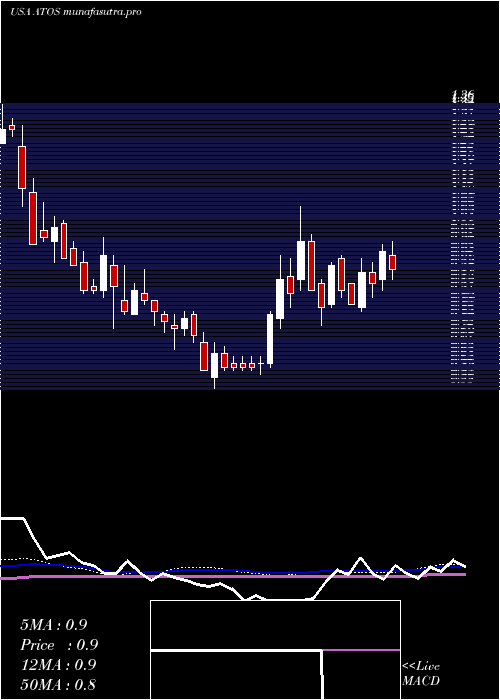
Weekly price and charts AtossaGenetics Strong weekly Stock price targets for AtossaGenetics ATOS are 1 and 1.04 | Weekly Target 1 | 0.96 | | Weekly Target 2 | 0.99 | | Weekly Target 3 | 1.0033333333333 | | Weekly Target 4 | 1.03 | | Weekly Target 5 | 1.04 |
Weekly price and volumes for Atossa Genetics
| Date |
Closing |
Open |
Range |
Volume |
Mon 20 October 2025 |
1.01 (3.06%) |
0.99 |
0.98 - 1.02 |
0.1469 times |
Fri 17 October 2025 |
0.98 (-9.26%) |
1.12 |
0.95 - 1.15 |
1.5723 times |
Fri 10 October 2025 |
1.08 (6.93%) |
1.01 |
0.97 - 1.29 |
3.3987 times |
Fri 03 October 2025 |
1.01 (17.44%) |
0.87 |
0.86 - 1.05 |
1.5955 times |
Fri 26 September 2025 |
0.86 (1.18%) |
0.84 |
0.82 - 0.87 |
0.6709 times |
Fri 19 September 2025 |
0.85 (1.19%) |
0.83 |
0.81 - 0.88 |
0.8795 times |
Fri 12 September 2025 |
0.84 (6.33%) |
0.80 |
0.78 - 0.85 |
0.7356 times |
Fri 05 September 2025 |
0.79 (3.95%) |
0.75 |
0.75 - 0.80 |
0.4399 times |
Fri 29 August 2025 |
0.76 (0%) |
0.77 |
0.75 - 0.77 |
0.0769 times |
Fri 29 August 2025 |
0.76 (-2.56%) |
0.79 |
0.75 - 0.79 |
0.4839 times |
Fri 22 August 2025 |
0.78 (0%) |
0.77 |
0.73 - 0.80 |
0.6627 times |
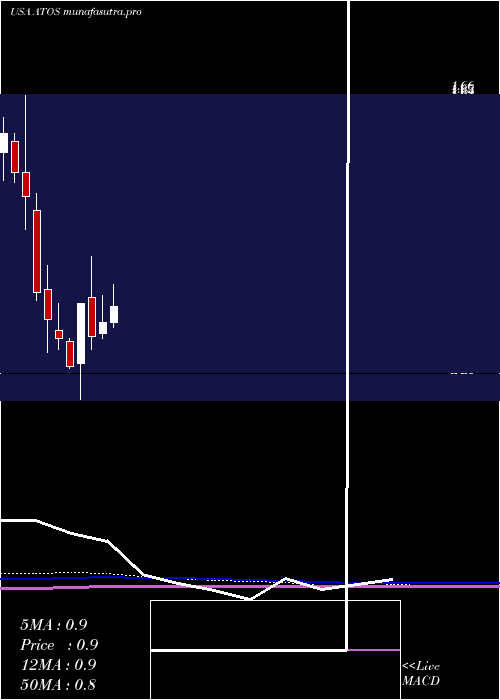
Monthly price and charts AtossaGenetics Strong monthly Stock price targets for AtossaGenetics ATOS are 0.94 and 1.37 | Monthly Target 1 | 0.62 | | Monthly Target 2 | 0.82 | | Monthly Target 3 | 1.0533333333333 | | Monthly Target 4 | 1.25 | | Monthly Target 5 | 1.48 |
Monthly price and volumes Atossa Genetics
| Date |
Closing |
Open |
Range |
Volume |
Mon 20 October 2025 |
1.01 (16.09%) |
0.86 |
0.86 - 1.29 |
1.4269 times |
Tue 30 September 2025 |
0.87 (14.47%) |
0.75 |
0.75 - 0.90 |
0.6832 times |
Fri 29 August 2025 |
0.76 (-8.43%) |
0.83 |
0.73 - 0.85 |
0.6758 times |
Thu 31 July 2025 |
0.83 (0%) |
0.83 |
0.81 - 0.98 |
1.6163 times |
Mon 30 June 2025 |
0.83 (6.41%) |
0.79 |
0.77 - 0.93 |
1.6963 times |
Fri 30 May 2025 |
0.78 (-13.33%) |
0.92 |
0.73 - 1.07 |
0.8865 times |
Wed 30 April 2025 |
0.90 (34.33%) |
0.68 |
0.55 - 0.90 |
0.7745 times |
Mon 31 March 2025 |
0.67 (-12.99%) |
0.76 |
0.66 - 0.77 |
0.5564 times |
Fri 28 February 2025 |
0.77 (-8.33%) |
0.80 |
0.73 - 0.90 |
0.6442 times |
Fri 31 January 2025 |
0.84 (-10.64%) |
0.95 |
0.72 - 1.04 |
1.0399 times |
Tue 31 December 2024 |
0.94 (-27.13%) |
1.24 |
0.91 - 1.30 |
0.9498 times |
DMA SMA EMA moving averages of Atossa Genetics ATOS
DMA (daily moving average) of Atossa Genetics ATOS
| DMA period | DMA value | | 5 day DMA | 1.02 | | 12 day DMA | 1.04 | | 20 day DMA | 0.97 | | 35 day DMA | 0.9 | | 50 day DMA | 0.86 | | 100 day DMA | 0.86 | | 150 day DMA | 0.82 | | 200 day DMA | 0.82 | EMA (exponential moving average) of Atossa Genetics ATOS
| EMA period | EMA current | EMA prev | EMA prev2 | | 5 day EMA | 1.02 | 1.02 | 1.04 | | 12 day EMA | 1.01 | 1.01 | 1.02 | | 20 day EMA | 0.97 | 0.97 | 0.97 | | 35 day EMA | 0.93 | 0.93 | 0.93 | | 50 day EMA | 0.88 | 0.87 | 0.87 |
SMA (simple moving average) of Atossa Genetics ATOS
| SMA period | SMA current | SMA prev | SMA prev2 | | 5 day SMA | 1.02 | 1.02 | 1.04 | | 12 day SMA | 1.04 | 1.04 | 1.03 | | 20 day SMA | 0.97 | 0.96 | 0.96 | | 35 day SMA | 0.9 | 0.9 | 0.89 | | 50 day SMA | 0.86 | 0.86 | 0.85 | | 100 day SMA | 0.86 | 0.85 | 0.85 | | 150 day SMA | 0.82 | 0.82 | 0.82 | | 200 day SMA | 0.82 | 0.82 | 0.82 |
|
|
