AtlanticusHoldings ATLC full analysis,charts,indicators,moving averages,SMA,DMA,EMA,ADX,MACD,RSIAtlanticus Holdings ATLC WideScreen charts, DMA,SMA,EMA technical analysis, forecast prediction, by indicators ADX,MACD,RSI,CCI USA stock exchange
operates under Finance sector & deals in Finance Consumer Services
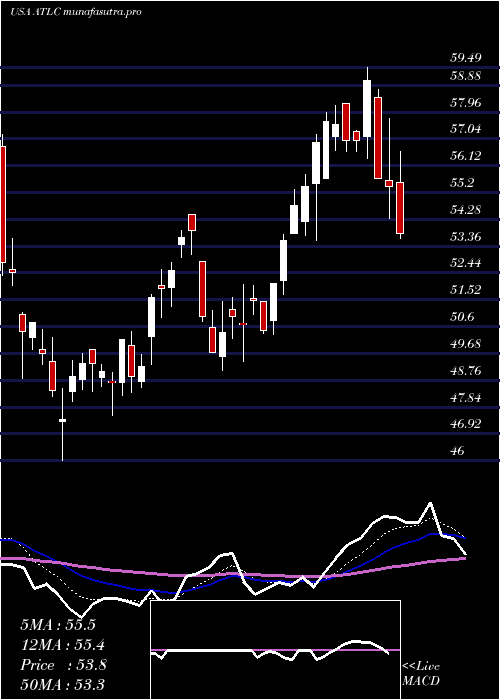
Daily price and charts and targets AtlanticusHoldings Strong Daily Stock price targets for AtlanticusHoldings ATLC are 55.07 and 57.05 | Daily Target 1 | 53.56 | | Daily Target 2 | 54.6 | | Daily Target 3 | 55.536666666667 | | Daily Target 4 | 56.58 | | Daily Target 5 | 57.52 |
Daily price and volume Atlanticus Holdings
| Date |
Closing |
Open |
Range |
Volume |
Tue 21 October 2025 |
55.65 (1.24%) |
54.53 |
54.49 - 56.47 |
0.7062 times |
Mon 20 October 2025 |
54.97 (2.33%) |
53.81 |
53.81 - 55.50 |
0.9706 times |
Fri 17 October 2025 |
53.72 (0.47%) |
53.54 |
53.44 - 54.83 |
0.5732 times |
Thu 16 October 2025 |
53.47 (-7.7%) |
57.99 |
53.24 - 58.01 |
1.0122 times |
Wed 15 October 2025 |
57.93 (-0.14%) |
59.08 |
57.02 - 59.61 |
0.8211 times |
Tue 14 October 2025 |
58.01 (3.09%) |
55.21 |
55.21 - 58.20 |
0.8668 times |
Mon 13 October 2025 |
56.27 (2.76%) |
55.42 |
54.41 - 56.31 |
0.8128 times |
Fri 10 October 2025 |
54.76 (-5.28%) |
58.02 |
54.63 - 60.37 |
1.2074 times |
Thu 09 October 2025 |
57.81 (4.41%) |
56.00 |
55.10 - 58.39 |
1.9648 times |
Wed 08 October 2025 |
55.37 (2.27%) |
54.19 |
54.19 - 55.92 |
1.0648 times |
Tue 07 October 2025 |
54.14 (-0.18%) |
53.96 |
52.78 - 54.55 |
1.2683 times |
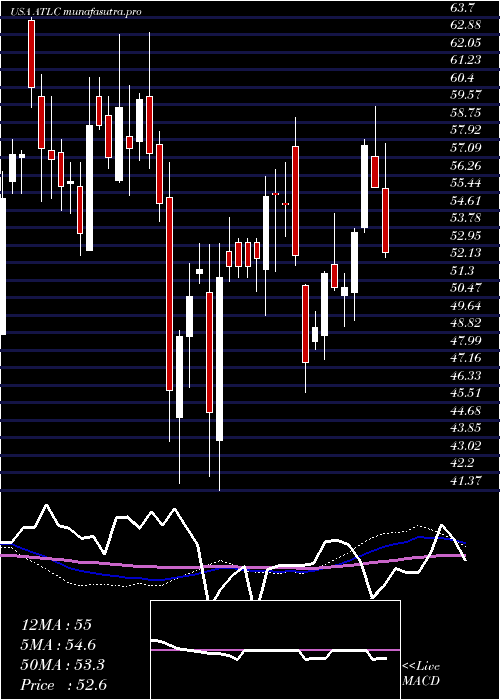
Weekly price and charts AtlanticusHoldings Strong weekly Stock price targets for AtlanticusHoldings ATLC are 54.73 and 57.39 | Weekly Target 1 | 52.65 | | Weekly Target 2 | 54.15 | | Weekly Target 3 | 55.31 | | Weekly Target 4 | 56.81 | | Weekly Target 5 | 57.97 |
Weekly price and volumes for Atlanticus Holdings
| Date |
Closing |
Open |
Range |
Volume |
Tue 21 October 2025 |
55.65 (3.59%) |
53.81 |
53.81 - 56.47 |
0.436 times |
Fri 17 October 2025 |
53.72 (-1.9%) |
55.42 |
53.24 - 59.61 |
1.0624 times |
Fri 10 October 2025 |
54.76 (-3.47%) |
56.90 |
52.78 - 60.37 |
1.6101 times |
Fri 03 October 2025 |
56.73 (-10.49%) |
63.60 |
55.16 - 63.60 |
1.4966 times |
Fri 26 September 2025 |
63.38 (-9.78%) |
70.08 |
62.92 - 70.98 |
1.1135 times |
Fri 19 September 2025 |
70.25 (-2.66%) |
75.31 |
69.04 - 78.91 |
2.3113 times |
Fri 12 September 2025 |
72.17 (6.38%) |
68.28 |
66.55 - 75.71 |
0.8072 times |
Fri 05 September 2025 |
67.84 (1.71%) |
65.47 |
64.75 - 69.94 |
0.4767 times |
Fri 29 August 2025 |
66.70 (0%) |
66.52 |
66.27 - 67.07 |
0.0752 times |
Fri 29 August 2025 |
66.70 (1.72%) |
65.47 |
65.02 - 67.60 |
0.611 times |
Fri 22 August 2025 |
65.57 (6.88%) |
61.35 |
60.00 - 65.95 |
0.9623 times |
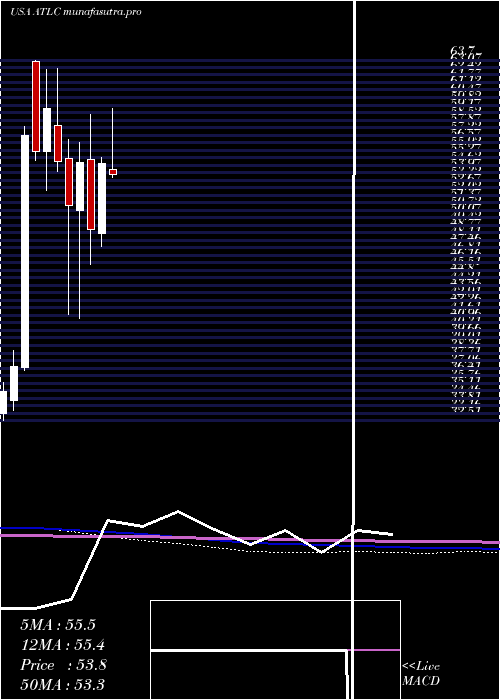
Monthly price and charts AtlanticusHoldings Strong monthly Stock price targets for AtlanticusHoldings ATLC are 50.42 and 58.01 | Monthly Target 1 | 48.68 | | Monthly Target 2 | 52.16 | | Monthly Target 3 | 56.266666666667 | | Monthly Target 4 | 59.75 | | Monthly Target 5 | 63.86 |
Monthly price and volumes Atlanticus Holdings
| Date |
Closing |
Open |
Range |
Volume |
Tue 21 October 2025 |
55.65 (-5%) |
58.58 |
52.78 - 60.37 |
0.8962 times |
Tue 30 September 2025 |
58.58 (-12.17%) |
65.47 |
57.01 - 78.91 |
1.2559 times |
Fri 29 August 2025 |
66.70 (34.39%) |
48.74 |
46.93 - 67.60 |
0.7742 times |
Thu 31 July 2025 |
49.63 (-9.35%) |
54.20 |
45.74 - 59.49 |
1.4243 times |
Mon 30 June 2025 |
54.75 (11.62%) |
48.70 |
47.56 - 55.30 |
0.9135 times |
Fri 30 May 2025 |
49.05 (-10.53%) |
55.08 |
46.00 - 58.99 |
0.8081 times |
Wed 30 April 2025 |
54.82 (7.17%) |
50.69 |
41.37 - 56.54 |
0.9008 times |
Mon 31 March 2025 |
51.15 (-6.88%) |
55.19 |
41.67 - 56.84 |
0.998 times |
Fri 28 February 2025 |
54.93 (-7.63%) |
58.08 |
54.05 - 63.00 |
0.894 times |
Fri 31 January 2025 |
59.47 (6.6%) |
55.79 |
52.45 - 62.91 |
1.135 times |
Tue 31 December 2024 |
55.79 (-2.5%) |
63.58 |
54.99 - 63.70 |
0.6958 times |
DMA SMA EMA moving averages of Atlanticus Holdings ATLC
DMA (daily moving average) of Atlanticus Holdings ATLC
| DMA period | DMA value | | 5 day DMA | 55.15 | | 12 day DMA | 55.53 | | 20 day DMA | 57.59 | | 35 day DMA | 62.85 | | 50 day DMA | 63.34 | | 100 day DMA | 57.95 | | 150 day DMA | 55.96 | | 200 day DMA | 55.84 | EMA (exponential moving average) of Atlanticus Holdings ATLC
| EMA period | EMA current | EMA prev | EMA prev2 | | 5 day EMA | 55.28 | 55.1 | 55.17 | | 12 day EMA | 56.35 | 56.48 | 56.75 | | 20 day EMA | 57.97 | 58.21 | 58.55 | | 35 day EMA | 59.58 | 59.81 | 60.09 | | 50 day EMA | 61.87 | 62.12 | 62.41 |
SMA (simple moving average) of Atlanticus Holdings ATLC
| SMA period | SMA current | SMA prev | SMA prev2 | | 5 day SMA | 55.15 | 55.62 | 55.88 | | 12 day SMA | 55.53 | 55.62 | 55.74 | | 20 day SMA | 57.59 | 58.21 | 58.97 | | 35 day SMA | 62.85 | 63.15 | 63.49 | | 50 day SMA | 63.34 | 63.44 | 63.53 | | 100 day SMA | 57.95 | 57.88 | 57.82 | | 150 day SMA | 55.96 | 55.91 | 55.84 | | 200 day SMA | 55.84 | 55.83 | 55.84 |
|
|
