AtaInc ATAI full analysis,charts,indicators,moving averages,SMA,DMA,EMA,ADX,MACD,RSIAta Inc ATAI WideScreen charts, DMA,SMA,EMA technical analysis, forecast prediction, by indicators ADX,MACD,RSI,CCI USA stock exchange
operates under Consumer Services sector & deals in Other Consumer Services
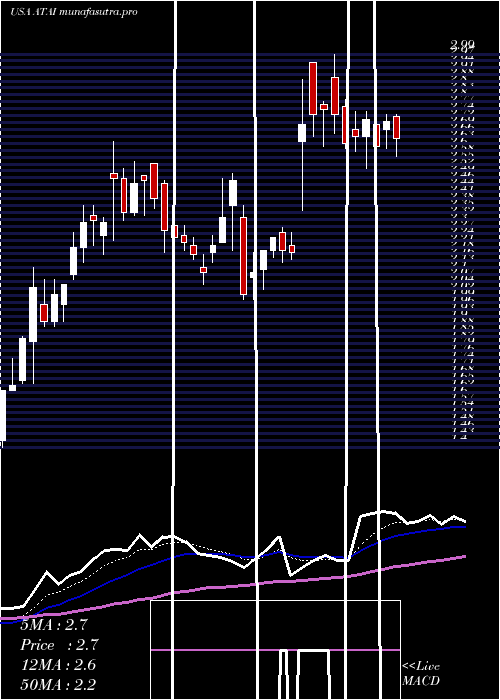
Daily price and charts and targets AtaInc Strong Daily Stock price targets for AtaInc ATAI are 5.52 and 6.22 | Daily Target 1 | 5.4 | | Daily Target 2 | 5.63 | | Daily Target 3 | 6.0966666666667 | | Daily Target 4 | 6.33 | | Daily Target 5 | 6.8 |
Daily price and volume Ata Inc
| Date |
Closing |
Open |
Range |
Volume |
Tue 21 October 2025 |
5.87 (-8.71%) |
6.56 |
5.86 - 6.56 |
0.8979 times |
Mon 20 October 2025 |
6.43 (-6.4%) |
6.90 |
6.28 - 7.01 |
1.0612 times |
Fri 17 October 2025 |
6.87 (23.12%) |
5.76 |
5.31 - 6.88 |
3.4036 times |
Thu 16 October 2025 |
5.58 (-6.38%) |
6.00 |
4.60 - 6.60 |
0.7105 times |
Wed 15 October 2025 |
5.96 (-0.67%) |
6.12 |
5.84 - 6.30 |
0.718 times |
Tue 14 October 2025 |
6.00 (11.11%) |
5.35 |
5.34 - 6.24 |
1.1147 times |
Mon 13 October 2025 |
5.40 (5.88%) |
5.21 |
5.06 - 5.43 |
0.5982 times |
Fri 10 October 2025 |
5.10 (-6.42%) |
5.45 |
5.09 - 5.48 |
0.5249 times |
Thu 09 October 2025 |
5.45 (-2.33%) |
5.65 |
5.36 - 5.83 |
0.5257 times |
Wed 08 October 2025 |
5.58 (0.72%) |
5.57 |
5.38 - 5.61 |
0.4452 times |
Tue 07 October 2025 |
5.54 (0.54%) |
5.52 |
5.38 - 5.69 |
0.4832 times |
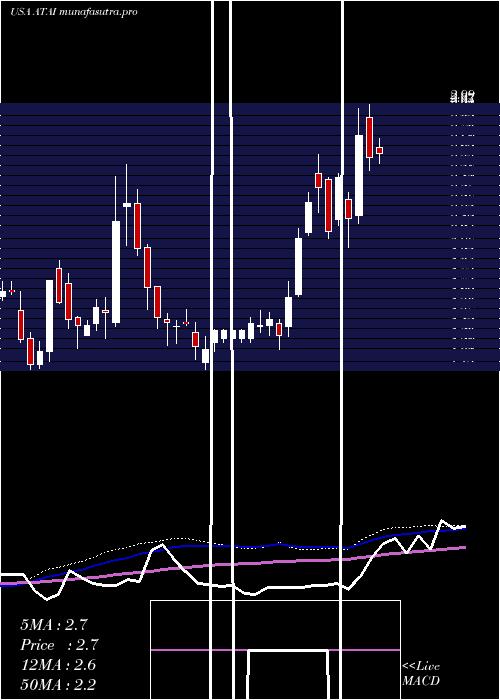
Weekly price and charts AtaInc Strong weekly Stock price targets for AtaInc ATAI are 5.29 and 6.44 | Weekly Target 1 | 5.1 | | Weekly Target 2 | 5.48 | | Weekly Target 3 | 6.2466666666667 | | Weekly Target 4 | 6.63 | | Weekly Target 5 | 7.4 |
Weekly price and volumes for Ata Inc
| Date |
Closing |
Open |
Range |
Volume |
Tue 21 October 2025 |
5.87 (-14.56%) |
6.90 |
5.86 - 7.01 |
0.653 times |
Fri 17 October 2025 |
6.87 (34.71%) |
5.21 |
4.60 - 6.88 |
2.1815 times |
Fri 10 October 2025 |
5.10 (-2.86%) |
5.23 |
5.09 - 5.83 |
0.8232 times |
Fri 03 October 2025 |
5.25 (-0.38%) |
5.37 |
4.85 - 5.52 |
0.9409 times |
Fri 26 September 2025 |
5.27 (6.46%) |
4.98 |
4.78 - 5.97 |
2.0061 times |
Fri 19 September 2025 |
4.95 (6.91%) |
4.67 |
4.50 - 5.06 |
0.7082 times |
Fri 12 September 2025 |
4.63 (1.31%) |
4.53 |
4.44 - 4.99 |
0.7042 times |
Fri 05 September 2025 |
4.57 (-0.22%) |
4.45 |
4.23 - 4.83 |
0.5512 times |
Fri 29 August 2025 |
4.58 (0%) |
4.65 |
4.40 - 4.73 |
0.1173 times |
Fri 29 August 2025 |
4.58 (0.22%) |
4.75 |
4.40 - 5.34 |
1.3146 times |
Fri 22 August 2025 |
4.57 (17.78%) |
3.83 |
3.76 - 4.74 |
1.0626 times |
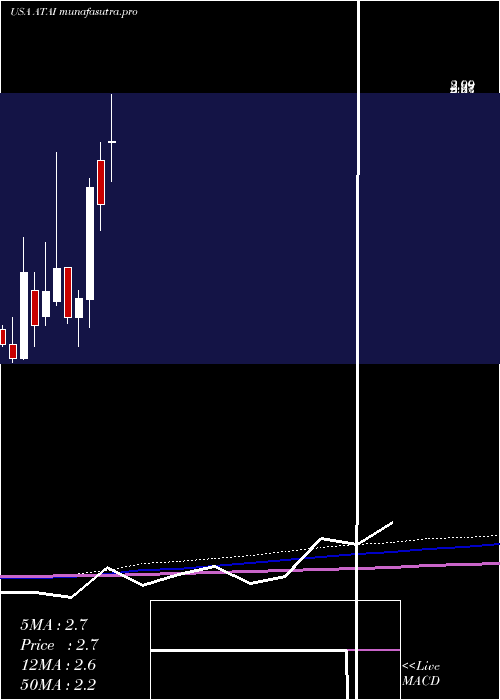
Monthly price and charts AtaInc Strong monthly Stock price targets for AtaInc ATAI are 5.24 and 7.65 | Monthly Target 1 | 3.42 | | Monthly Target 2 | 4.64 | | Monthly Target 3 | 5.8266666666667 | | Monthly Target 4 | 7.05 | | Monthly Target 5 | 8.24 |
Monthly price and volumes Ata Inc
| Date |
Closing |
Open |
Range |
Volume |
Tue 21 October 2025 |
5.87 (10.96%) |
5.28 |
4.60 - 7.01 |
1.2999 times |
Tue 30 September 2025 |
5.29 (15.5%) |
4.45 |
4.23 - 5.97 |
1.3747 times |
Fri 29 August 2025 |
4.58 (11.71%) |
4.00 |
3.60 - 5.34 |
1.4061 times |
Thu 31 July 2025 |
4.10 (87.21%) |
2.64 |
2.36 - 4.29 |
2.3618 times |
Mon 30 June 2025 |
2.19 (-5.19%) |
2.51 |
2.00 - 2.64 |
0.6176 times |
Fri 30 May 2025 |
2.31 (54%) |
1.49 |
1.29 - 2.38 |
0.5335 times |
Wed 30 April 2025 |
1.50 (10.29%) |
1.36 |
1.15 - 1.56 |
0.3957 times |
Mon 31 March 2025 |
1.36 (-20.93%) |
1.73 |
1.32 - 1.73 |
0.3718 times |
Fri 28 February 2025 |
1.72 (10.97%) |
1.48 |
1.45 - 2.57 |
1.1882 times |
Fri 31 January 2025 |
1.55 (19.23%) |
1.37 |
1.30 - 1.91 |
0.4507 times |
Tue 31 December 2024 |
1.30 (-23.08%) |
1.56 |
1.15 - 1.69 |
0.2411 times |
DMA SMA EMA moving averages of Ata Inc ATAI
DMA (daily moving average) of Ata Inc ATAI
| DMA period | DMA value | | 5 day DMA | 6.14 | | 12 day DMA | 5.77 | | 20 day DMA | 5.58 | | 35 day DMA | 5.22 | | 50 day DMA | 4.96 | | 100 day DMA | 3.93 | | 150 day DMA | 3.12 | | 200 day DMA | 2.77 | EMA (exponential moving average) of Ata Inc ATAI
| EMA period | EMA current | EMA prev | EMA prev2 | | 5 day EMA | 6.08 | 6.18 | 6.06 | | 12 day EMA | 5.84 | 5.83 | 5.72 | | 20 day EMA | 5.62 | 5.59 | 5.5 | | 35 day EMA | 5.31 | 5.28 | 5.21 | | 50 day EMA | 5.01 | 4.98 | 4.92 |
SMA (simple moving average) of Ata Inc ATAI
| SMA period | SMA current | SMA prev | SMA prev2 | | 5 day SMA | 6.14 | 6.17 | 5.96 | | 12 day SMA | 5.77 | 5.72 | 5.61 | | 20 day SMA | 5.58 | 5.56 | 5.49 | | 35 day SMA | 5.22 | 5.18 | 5.13 | | 50 day SMA | 4.96 | 4.93 | 4.88 | | 100 day SMA | 3.93 | 3.89 | 3.85 | | 150 day SMA | 3.12 | 3.09 | 3.06 | | 200 day SMA | 2.77 | 2.75 | 2.73 |
|
|
