AstecIndustries ASTE full analysis,charts,indicators,moving averages,SMA,DMA,EMA,ADX,MACD,RSIAstec Industries ASTE WideScreen charts, DMA,SMA,EMA technical analysis, forecast prediction, by indicators ADX,MACD,RSI,CCI USA stock exchange
operates under Capital Goods sector & deals in Construction Ag Equipment Trucks
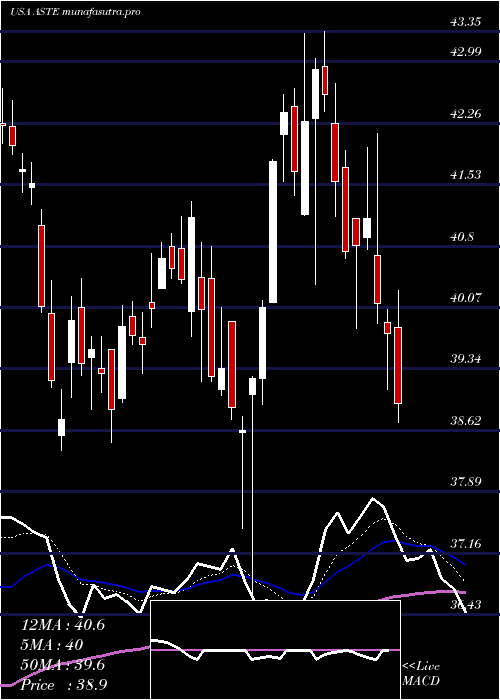
Daily price and charts and targets AstecIndustries Strong Daily Stock price targets for AstecIndustries ASTE are 44.34 and 46.02 | Daily Target 1 | 44.05 | | Daily Target 2 | 44.63 | | Daily Target 3 | 45.726666666667 | | Daily Target 4 | 46.31 | | Daily Target 5 | 47.41 |
Daily price and volume Astec Industries
| Date |
Closing |
Open |
Range |
Volume |
Fri 05 December 2025 |
45.22 (-2.46%) |
46.28 |
45.14 - 46.82 |
0.598 times |
Thu 04 December 2025 |
46.36 (1.4%) |
45.86 |
45.20 - 46.85 |
1.7354 times |
Wed 03 December 2025 |
45.72 (3.98%) |
44.08 |
43.83 - 45.89 |
0.964 times |
Tue 02 December 2025 |
43.97 (0.53%) |
44.22 |
43.65 - 44.33 |
1.0803 times |
Mon 01 December 2025 |
43.74 (-1.17%) |
43.77 |
43.29 - 44.55 |
0.7816 times |
Fri 28 November 2025 |
44.26 (0.59%) |
44.30 |
43.58 - 44.55 |
0.362 times |
Wed 26 November 2025 |
44.00 (-0.05%) |
43.72 |
43.24 - 44.52 |
1.3593 times |
Tue 25 November 2025 |
44.02 (3.72%) |
42.82 |
42.61 - 44.38 |
1.2638 times |
Mon 24 November 2025 |
42.44 (1.48%) |
41.87 |
40.81 - 42.57 |
0.89 times |
Fri 21 November 2025 |
41.82 (2.88%) |
40.64 |
40.47 - 42.31 |
0.9657 times |
Thu 20 November 2025 |
40.65 (-1.24%) |
41.75 |
40.59 - 42.18 |
0.8595 times |
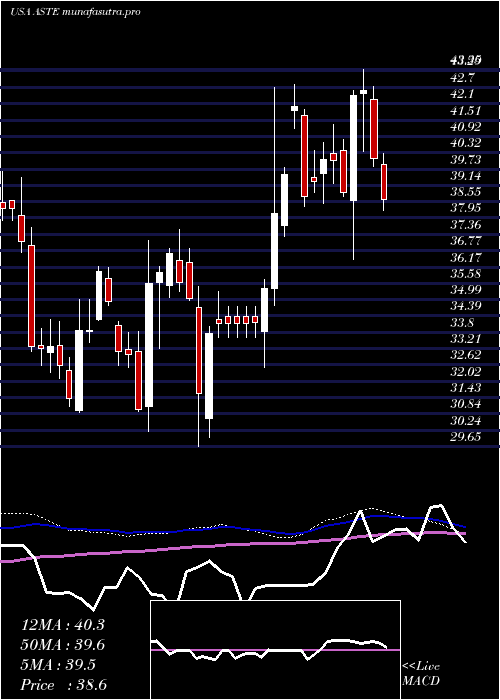
Weekly price and charts AstecIndustries Strong weekly Stock price targets for AstecIndustries ASTE are 44.26 and 47.82 | Weekly Target 1 | 41.56 | | Weekly Target 2 | 43.39 | | Weekly Target 3 | 45.12 | | Weekly Target 4 | 46.95 | | Weekly Target 5 | 48.68 |
Weekly price and volumes for Astec Industries
| Date |
Closing |
Open |
Range |
Volume |
Fri 05 December 2025 |
45.22 (2.17%) |
43.77 |
43.29 - 46.85 |
1.2221 times |
Fri 28 November 2025 |
44.26 (5.83%) |
41.87 |
40.81 - 44.55 |
0.9179 times |
Fri 21 November 2025 |
41.82 (-4.35%) |
43.69 |
40.47 - 43.94 |
1.3513 times |
Fri 14 November 2025 |
43.72 (-2.82%) |
45.28 |
43.14 - 46.65 |
1.21 times |
Fri 07 November 2025 |
44.99 (-3.31%) |
46.55 |
41.96 - 47.70 |
1.4327 times |
Fri 31 October 2025 |
46.53 (0%) |
46.73 |
45.97 - 46.82 |
0.1719 times |
Fri 31 October 2025 |
46.53 (-3.9%) |
48.70 |
45.97 - 48.87 |
0.8448 times |
Fri 24 October 2025 |
48.42 (4.83%) |
46.70 |
46.48 - 48.91 |
0.9143 times |
Fri 17 October 2025 |
46.19 (4.38%) |
45.14 |
44.23 - 47.93 |
0.9404 times |
Fri 10 October 2025 |
44.25 (-10.53%) |
49.82 |
44.07 - 50.29 |
0.9947 times |
Fri 03 October 2025 |
49.46 (3.65%) |
47.92 |
47.22 - 50.83 |
1.0352 times |
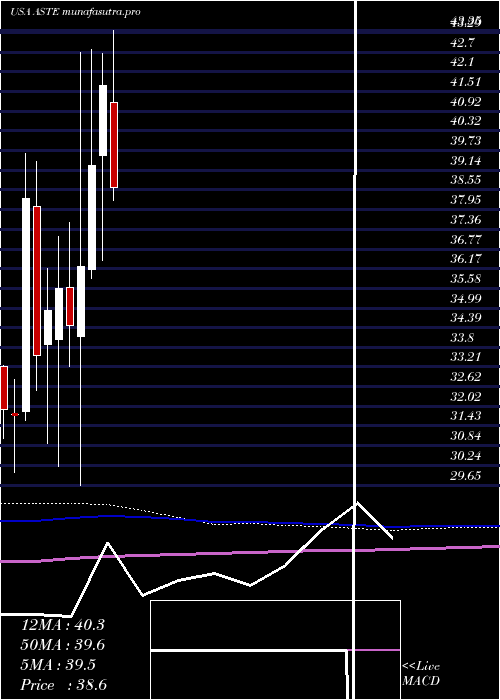
Monthly price and charts AstecIndustries Strong monthly Stock price targets for AstecIndustries ASTE are 44.26 and 47.82 | Monthly Target 1 | 41.56 | | Monthly Target 2 | 43.39 | | Monthly Target 3 | 45.12 | | Monthly Target 4 | 46.95 | | Monthly Target 5 | 48.68 |
Monthly price and volumes Astec Industries
| Date |
Closing |
Open |
Range |
Volume |
Fri 05 December 2025 |
45.22 (2.17%) |
43.77 |
43.29 - 46.85 |
0.2861 times |
Fri 28 November 2025 |
44.26 (-4.88%) |
46.55 |
40.47 - 47.70 |
1.15 times |
Fri 31 October 2025 |
46.53 (-3.32%) |
47.66 |
44.07 - 50.83 |
1.0412 times |
Tue 30 September 2025 |
48.13 (3.97%) |
45.70 |
45.30 - 49.06 |
1.189 times |
Fri 29 August 2025 |
46.29 (16.72%) |
38.97 |
37.88 - 47.94 |
1.4706 times |
Thu 31 July 2025 |
39.66 (-4.87%) |
41.18 |
37.82 - 43.35 |
1.1113 times |
Mon 30 June 2025 |
41.69 (6.11%) |
39.57 |
36.43 - 42.67 |
0.9895 times |
Fri 30 May 2025 |
39.29 (8.45%) |
36.15 |
35.87 - 42.79 |
0.8886 times |
Wed 30 April 2025 |
36.23 (5.17%) |
34.13 |
29.65 - 42.70 |
0.9633 times |
Mon 31 March 2025 |
34.45 (-3.18%) |
35.60 |
33.21 - 37.55 |
0.9104 times |
Fri 28 February 2025 |
35.58 (1.92%) |
34.05 |
30.20 - 37.13 |
1.1027 times |
DMA SMA EMA moving averages of Astec Industries ASTE
DMA (daily moving average) of Astec Industries ASTE
| DMA period | DMA value | | 5 day DMA | 45 | | 12 day DMA | 43.61 | | 20 day DMA | 43.72 | | 35 day DMA | 45.14 | | 50 day DMA | 45.81 | | 100 day DMA | 45.02 | | 150 day DMA | 43.44 | | 200 day DMA | 41.22 | EMA (exponential moving average) of Astec Industries ASTE
| EMA period | EMA current | EMA prev | EMA prev2 | | 5 day EMA | 45.09 | 45.03 | 44.37 | | 12 day EMA | 44.41 | 44.26 | 43.88 | | 20 day EMA | 44.41 | 44.33 | 44.12 | | 35 day EMA | 44.94 | 44.92 | 44.83 | | 50 day EMA | 45.88 | 45.91 | 45.89 |
SMA (simple moving average) of Astec Industries ASTE
| SMA period | SMA current | SMA prev | SMA prev2 | | 5 day SMA | 45 | 44.81 | 44.34 | | 12 day SMA | 43.61 | 43.28 | 42.94 | | 20 day SMA | 43.72 | 43.74 | 43.69 | | 35 day SMA | 45.14 | 45.21 | 45.24 | | 50 day SMA | 45.81 | 45.84 | 45.87 | | 100 day SMA | 45.02 | 44.96 | 44.88 | | 150 day SMA | 43.44 | 43.38 | 43.32 | | 200 day SMA | 41.22 | 41.16 | 41.1 |
|
|
