AstrotechCorporation ASTC full analysis,charts,indicators,moving averages,SMA,DMA,EMA,ADX,MACD,RSIAstrotech Corporation ASTC WideScreen charts, DMA,SMA,EMA technical analysis, forecast prediction, by indicators ADX,MACD,RSI,CCI USA stock exchange
operates under Capital Goods sector & deals in Biotechnology Laboratory Analytical Instruments
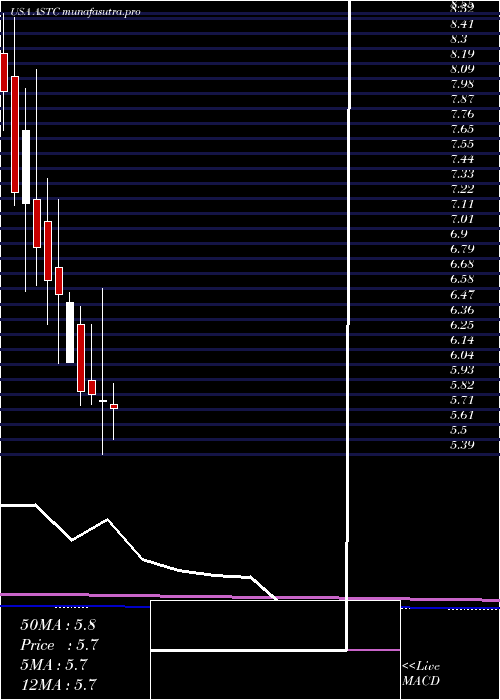
Daily price and charts and targets AstrotechCorporation Strong Daily Stock price targets for AstrotechCorporation ASTC are 3.35 and 3.47 | Daily Target 1 | 3.25 | | Daily Target 2 | 3.32 | | Daily Target 3 | 3.37 | | Daily Target 4 | 3.44 | | Daily Target 5 | 3.49 |
Daily price and volume Astrotech Corporation
| Date |
Closing |
Open |
Range |
Volume |
Thu 04 December 2025 |
3.39 (0.3%) |
3.30 |
3.30 - 3.42 |
0.1818 times |
Wed 03 December 2025 |
3.38 (2.42%) |
3.34 |
3.30 - 3.43 |
0.9284 times |
Tue 02 December 2025 |
3.30 (0.61%) |
3.33 |
3.13 - 3.41 |
0.7876 times |
Mon 01 December 2025 |
3.28 (2.5%) |
3.21 |
3.20 - 3.28 |
0.689 times |
Fri 28 November 2025 |
3.20 (-1.54%) |
3.27 |
3.20 - 3.27 |
0.1285 times |
Wed 26 November 2025 |
3.25 (6.91%) |
3.10 |
3.09 - 3.29 |
0.689 times |
Tue 25 November 2025 |
3.04 (6.67%) |
2.91 |
2.87 - 3.04 |
0.5606 times |
Mon 24 November 2025 |
2.85 (4.4%) |
2.73 |
2.68 - 2.92 |
1.2788 times |
Fri 21 November 2025 |
2.73 (-5.21%) |
2.88 |
2.47 - 2.88 |
1.3756 times |
Thu 20 November 2025 |
2.88 (-14.54%) |
3.35 |
2.87 - 3.37 |
3.3808 times |
Wed 19 November 2025 |
3.37 (-0.88%) |
3.45 |
3.34 - 3.48 |
1.3255 times |
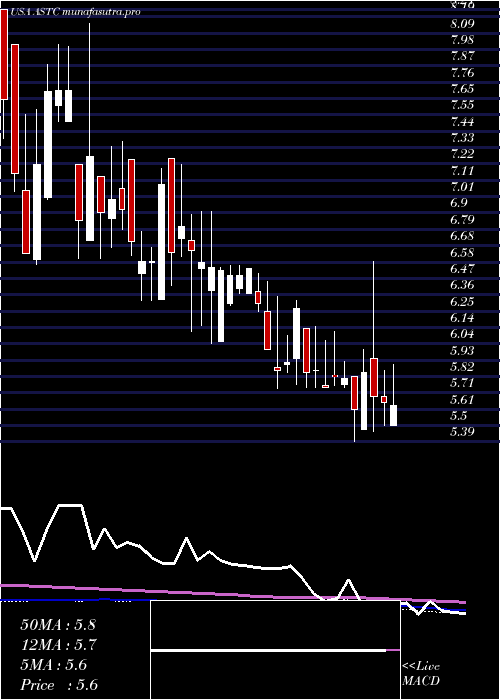
Weekly price and charts AstrotechCorporation Strong weekly Stock price targets for AstrotechCorporation ASTC are 3.26 and 3.56 | Weekly Target 1 | 3.02 | | Weekly Target 2 | 3.2 | | Weekly Target 3 | 3.3166666666667 | | Weekly Target 4 | 3.5 | | Weekly Target 5 | 3.62 |
Weekly price and volumes for Astrotech Corporation
| Date |
Closing |
Open |
Range |
Volume |
Thu 04 December 2025 |
3.39 (5.94%) |
3.21 |
3.13 - 3.43 |
0.271 times |
Fri 28 November 2025 |
3.20 (17.22%) |
2.73 |
2.68 - 3.29 |
0.2784 times |
Fri 21 November 2025 |
2.73 (-16.77%) |
3.22 |
2.47 - 3.48 |
0.8715 times |
Fri 14 November 2025 |
3.28 (3.14%) |
3.34 |
3.05 - 3.41 |
0.3248 times |
Fri 07 November 2025 |
3.18 (-17.83%) |
3.63 |
3.13 - 3.77 |
0.3414 times |
Fri 31 October 2025 |
3.87 (0%) |
3.96 |
3.84 - 3.96 |
0.082 times |
Fri 31 October 2025 |
3.87 (-4.68%) |
4.08 |
3.84 - 4.29 |
0.5579 times |
Fri 24 October 2025 |
4.06 (5.45%) |
3.92 |
3.75 - 4.30 |
1.0639 times |
Fri 17 October 2025 |
3.85 (-12.5%) |
4.40 |
3.80 - 4.66 |
1.163 times |
Fri 10 October 2025 |
4.40 (-25.68%) |
5.59 |
4.34 - 5.87 |
5.0462 times |
Fri 03 October 2025 |
5.92 (18.4%) |
4.82 |
4.75 - 8.01 |
158.3419 times |
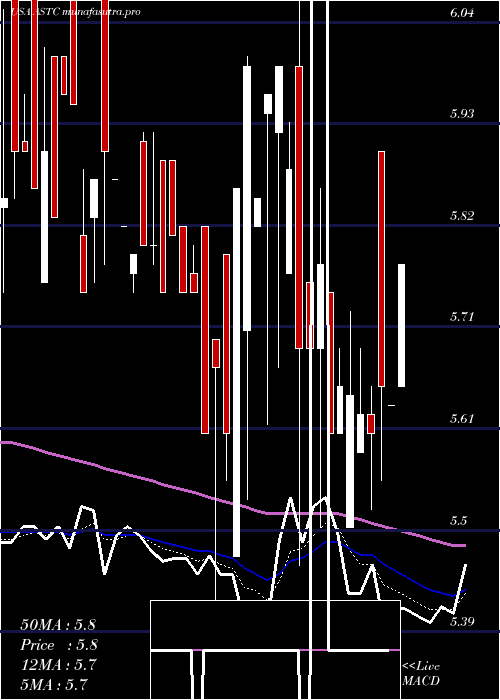
Monthly price and charts AstrotechCorporation Strong monthly Stock price targets for AstrotechCorporation ASTC are 3.26 and 3.56 | Monthly Target 1 | 3.02 | | Monthly Target 2 | 3.2 | | Monthly Target 3 | 3.3166666666667 | | Monthly Target 4 | 3.5 | | Monthly Target 5 | 3.62 |
Monthly price and volumes Astrotech Corporation
| Date |
Closing |
Open |
Range |
Volume |
Thu 04 December 2025 |
3.39 (5.94%) |
3.21 |
3.13 - 3.43 |
0.0157 times |
Fri 28 November 2025 |
3.20 (-17.31%) |
3.63 |
2.47 - 3.77 |
0.1054 times |
Fri 31 October 2025 |
3.87 (-21.02%) |
4.89 |
3.75 - 8.01 |
9.6107 times |
Tue 30 September 2025 |
4.90 (-4.85%) |
5.11 |
4.75 - 5.48 |
0.0942 times |
Fri 29 August 2025 |
5.15 (-8.69%) |
5.64 |
4.71 - 5.64 |
0.0348 times |
Thu 31 July 2025 |
5.64 (-2.42%) |
5.75 |
5.40 - 5.90 |
0.0251 times |
Mon 30 June 2025 |
5.78 (-0.69%) |
5.77 |
5.39 - 6.58 |
0.0588 times |
Fri 30 May 2025 |
5.82 (-0.34%) |
5.92 |
5.75 - 6.32 |
0.0219 times |
Wed 30 April 2025 |
5.84 (-9.88%) |
6.32 |
5.74 - 6.45 |
0.0213 times |
Mon 31 March 2025 |
6.48 (-0.92%) |
6.05 |
6.05 - 6.55 |
0.0119 times |
Fri 28 February 2025 |
6.54 (-1.51%) |
6.73 |
6.04 - 7.22 |
0.0316 times |
DMA SMA EMA moving averages of Astrotech Corporation ASTC
DMA (daily moving average) of Astrotech Corporation ASTC
| DMA period | DMA value | | 5 day DMA | 3.31 | | 12 day DMA | 3.17 | | 20 day DMA | 3.22 | | 35 day DMA | 3.54 | | 50 day DMA | 3.96 | | 100 day DMA | 4.59 | | 150 day DMA | 5 | | 200 day DMA | 5.33 | EMA (exponential moving average) of Astrotech Corporation ASTC
| EMA period | EMA current | EMA prev | EMA prev2 | | 5 day EMA | 3.31 | 3.27 | 3.21 | | 12 day EMA | 3.26 | 3.24 | 3.22 | | 20 day EMA | 3.34 | 3.33 | 3.33 | | 35 day EMA | 3.64 | 3.66 | 3.68 | | 50 day EMA | 3.99 | 4.01 | 4.04 |
SMA (simple moving average) of Astrotech Corporation ASTC
| SMA period | SMA current | SMA prev | SMA prev2 | | 5 day SMA | 3.31 | 3.28 | 3.21 | | 12 day SMA | 3.17 | 3.17 | 3.16 | | 20 day SMA | 3.22 | 3.23 | 3.23 | | 35 day SMA | 3.54 | 3.56 | 3.59 | | 50 day SMA | 3.96 | 4 | 4.04 | | 100 day SMA | 4.59 | 4.62 | 4.64 | | 150 day SMA | 5 | 5.01 | 5.03 | | 200 day SMA | 5.33 | 5.35 | 5.36 |
|
|
