AltisourcePortfolio ASPS full analysis,charts,indicators,moving averages,SMA,DMA,EMA,ADX,MACD,RSIAltisource Portfolio ASPS WideScreen charts, DMA,SMA,EMA technical analysis, forecast prediction, by indicators ADX,MACD,RSI,CCI USA stock exchange
operates under Consumer Services sector & deals in Other Consumer Services
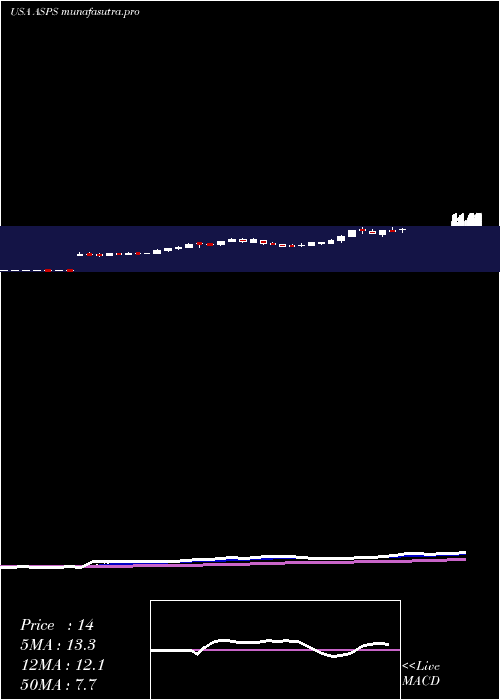
Daily price and charts and targets AltisourcePortfolio Strong Daily Stock price targets for AltisourcePortfolio ASPS are 11.48 and 11.95 | Daily Target 1 | 11.4 | | Daily Target 2 | 11.55 | | Daily Target 3 | 11.866666666667 | | Daily Target 4 | 12.02 | | Daily Target 5 | 12.34 |
Daily price and volume Altisource Portfolio
| Date |
Closing |
Open |
Range |
Volume |
Tue 21 October 2025 |
11.71 (-2.01%) |
11.81 |
11.71 - 12.18 |
0.8382 times |
Mon 20 October 2025 |
11.95 (0.42%) |
12.46 |
11.83 - 12.46 |
0.2704 times |
Fri 17 October 2025 |
11.90 (-1.24%) |
12.05 |
11.70 - 12.20 |
0.6952 times |
Thu 16 October 2025 |
12.05 (1.35%) |
12.14 |
11.83 - 12.14 |
0.394 times |
Wed 15 October 2025 |
11.89 (-4.34%) |
12.84 |
11.79 - 12.84 |
1.4909 times |
Tue 14 October 2025 |
12.43 (1.64%) |
12.50 |
12.15 - 12.78 |
1.5025 times |
Mon 13 October 2025 |
12.23 (-2.24%) |
13.00 |
12.23 - 13.00 |
0.8304 times |
Fri 10 October 2025 |
12.51 (-10.26%) |
13.86 |
12.00 - 14.00 |
1.7845 times |
Thu 09 October 2025 |
13.94 (4.97%) |
13.27 |
12.64 - 13.95 |
1.0236 times |
Wed 08 October 2025 |
13.28 (2.23%) |
12.98 |
12.65 - 13.39 |
1.1703 times |
Tue 07 October 2025 |
12.99 (-3.56%) |
14.36 |
12.42 - 14.36 |
1.433 times |
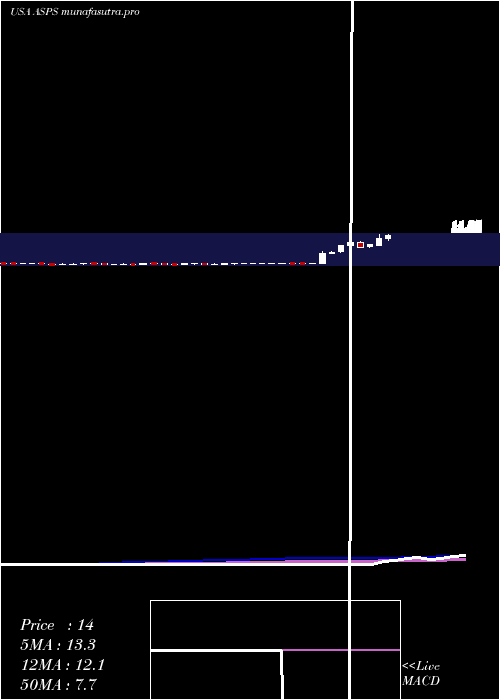
Weekly price and charts AltisourcePortfolio Strong weekly Stock price targets for AltisourcePortfolio ASPS are 11.34 and 12.09 | Weekly Target 1 | 11.21 | | Weekly Target 2 | 11.46 | | Weekly Target 3 | 11.96 | | Weekly Target 4 | 12.21 | | Weekly Target 5 | 12.71 |
Weekly price and volumes for Altisource Portfolio
| Date |
Closing |
Open |
Range |
Volume |
Tue 21 October 2025 |
11.71 (-1.6%) |
12.46 |
11.71 - 12.46 |
0.2847 times |
Fri 17 October 2025 |
11.90 (-4.88%) |
13.00 |
11.70 - 13.00 |
1.2616 times |
Fri 10 October 2025 |
12.51 (-2.72%) |
13.07 |
12.00 - 14.36 |
2.0016 times |
Fri 03 October 2025 |
12.86 (15.65%) |
11.08 |
11.00 - 13.49 |
1.9908 times |
Fri 26 September 2025 |
11.12 (-0.89%) |
11.00 |
10.80 - 12.27 |
1.0881 times |
Fri 19 September 2025 |
11.22 (0.09%) |
11.01 |
10.56 - 11.67 |
1.7268 times |
Fri 12 September 2025 |
11.21 (-0.53%) |
11.23 |
10.72 - 11.88 |
0.5257 times |
Fri 05 September 2025 |
11.27 (-1.66%) |
11.36 |
10.88 - 11.95 |
0.3848 times |
Fri 29 August 2025 |
11.46 (0%) |
11.20 |
10.77 - 11.49 |
0.0823 times |
Fri 29 August 2025 |
11.46 (-0.69%) |
12.20 |
10.77 - 12.59 |
0.6536 times |
Fri 22 August 2025 |
11.54 (10.01%) |
10.53 |
10.33 - 12.58 |
0.8857 times |
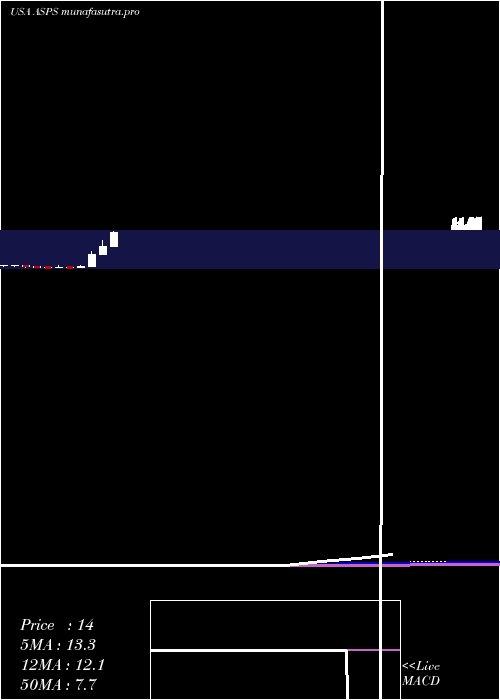
Monthly price and charts AltisourcePortfolio Strong monthly Stock price targets for AltisourcePortfolio ASPS are 11.68 and 14.39 | Monthly Target 1 | 9.86 | | Monthly Target 2 | 10.79 | | Monthly Target 3 | 12.573333333333 | | Monthly Target 4 | 13.5 | | Monthly Target 5 | 15.28 |
Monthly price and volumes Altisource Portfolio
| Date |
Closing |
Open |
Range |
Volume |
Tue 21 October 2025 |
11.71 (0.43%) |
11.65 |
11.65 - 14.36 |
0.2464 times |
Tue 30 September 2025 |
11.66 (1.75%) |
11.36 |
10.56 - 12.54 |
0.2577 times |
Fri 29 August 2025 |
11.46 (3.06%) |
10.90 |
9.31 - 12.59 |
0.1627 times |
Thu 31 July 2025 |
11.12 (30.36%) |
8.81 |
8.56 - 15.96 |
0.4852 times |
Mon 30 June 2025 |
8.53 (51.78%) |
5.58 |
5.58 - 11.14 |
0.6942 times |
Fri 30 May 2025 |
5.62 (450.98%) |
1.06 |
0.74 - 6.61 |
1.4682 times |
Wed 30 April 2025 |
1.02 (50%) |
0.67 |
0.65 - 1.14 |
1.6153 times |
Mon 31 March 2025 |
0.68 (-1.45%) |
0.70 |
0.65 - 0.95 |
1.2422 times |
Fri 28 February 2025 |
0.69 (2.99%) |
0.67 |
0.65 - 1.16 |
1.8224 times |
Fri 31 January 2025 |
0.67 (1.52%) |
0.68 |
0.62 - 1.04 |
2.0058 times |
Tue 31 December 2024 |
0.66 (-21.43%) |
0.81 |
0.43 - 0.86 |
2.8831 times |
DMA SMA EMA moving averages of Altisource Portfolio ASPS
DMA (daily moving average) of Altisource Portfolio ASPS
| DMA period | DMA value | | 5 day DMA | 11.9 | | 12 day DMA | 12.53 | | 20 day DMA | 12.19 | | 35 day DMA | 11.78 | | 50 day DMA | 11.6 | | 100 day DMA | 10.89 | | 150 day DMA | 7.58 | | 200 day DMA | 5.88 | EMA (exponential moving average) of Altisource Portfolio ASPS
| EMA period | EMA current | EMA prev | EMA prev2 | | 5 day EMA | 11.96 | 12.08 | 12.15 | | 12 day EMA | 12.15 | 12.23 | 12.28 | | 20 day EMA | 12.08 | 12.12 | 12.14 | | 35 day EMA | 11.89 | 11.9 | 11.9 | | 50 day EMA | 11.56 | 11.55 | 11.53 |
SMA (simple moving average) of Altisource Portfolio ASPS
| SMA period | SMA current | SMA prev | SMA prev2 | | 5 day SMA | 11.9 | 12.04 | 12.1 | | 12 day SMA | 12.53 | 12.63 | 12.63 | | 20 day SMA | 12.19 | 12.17 | 12.13 | | 35 day SMA | 11.78 | 11.77 | 11.76 | | 50 day SMA | 11.6 | 11.57 | 11.55 | | 100 day SMA | 10.89 | 10.84 | 10.72 | | 150 day SMA | 7.58 | 7.51 | 7.43 | | 200 day SMA | 5.88 | 5.82 | 5.76 |
|
|
