ArsanisInc ASNS full analysis,charts,indicators,moving averages,SMA,DMA,EMA,ADX,MACD,RSIArsanis Inc ASNS WideScreen charts, DMA,SMA,EMA technical analysis, forecast prediction, by indicators ADX,MACD,RSI,CCI USA stock exchange
operates under Health Care sector & deals in Biotechnology Biological Products No Diagnostic Substances
Daily price and charts and targets ArsanisInc Strong Daily Stock price targets for ArsanisInc ASNS are 3.02 and 3.32 | Daily Target 1 | 2.77 | | Daily Target 2 | 2.97 | | Daily Target 3 | 3.07 | | Daily Target 4 | 3.27 | | Daily Target 5 | 3.37 |
Daily price and volume Arsanis Inc
| Date |
Closing |
Open |
Range |
Volume |
Thu 04 December 2025 |
3.17 (9.69%) |
2.88 |
2.87 - 3.17 |
1.1982 times |
Wed 03 December 2025 |
2.89 (-4.93%) |
2.99 |
2.86 - 3.03 |
1.0378 times |
Tue 02 December 2025 |
3.04 (-2.25%) |
3.00 |
2.88 - 3.25 |
0.6899 times |
Mon 01 December 2025 |
3.11 (0.32%) |
3.04 |
2.96 - 3.30 |
0.8445 times |
Fri 28 November 2025 |
3.10 (5.8%) |
2.96 |
2.93 - 3.12 |
0.5817 times |
Wed 26 November 2025 |
2.93 (5.4%) |
2.79 |
2.78 - 2.95 |
0.7769 times |
Tue 25 November 2025 |
2.78 (0%) |
2.80 |
2.74 - 3.00 |
1.1596 times |
Mon 24 November 2025 |
2.78 (-11.18%) |
3.15 |
2.64 - 3.15 |
1.2088 times |
Fri 21 November 2025 |
3.13 (-2.19%) |
3.16 |
2.90 - 3.20 |
1.0861 times |
Thu 20 November 2025 |
3.20 (-3.32%) |
3.28 |
3.12 - 3.49 |
1.4165 times |
Wed 19 November 2025 |
3.31 (5.08%) |
3.13 |
3.13 - 3.63 |
2.464 times |
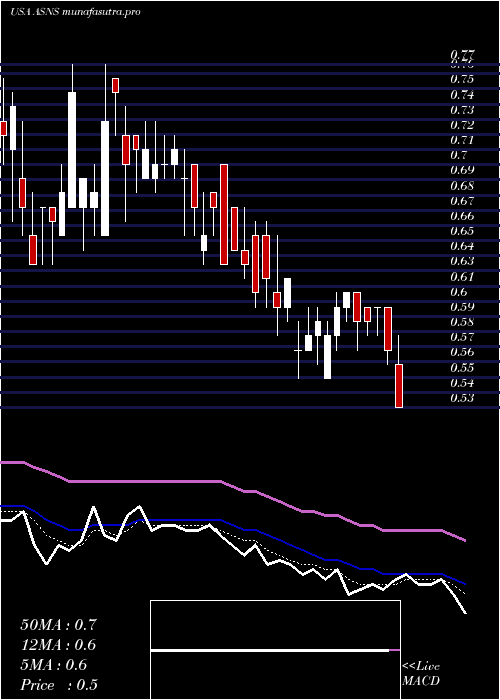
Weekly price and charts ArsanisInc Strong weekly Stock price targets for ArsanisInc ASNS are 3.02 and 3.46 | Weekly Target 1 | 2.67 | | Weekly Target 2 | 2.92 | | Weekly Target 3 | 3.11 | | Weekly Target 4 | 3.36 | | Weekly Target 5 | 3.55 |
Weekly price and volumes for Arsanis Inc
| Date |
Closing |
Open |
Range |
Volume |
Thu 04 December 2025 |
3.17 (2.26%) |
3.04 |
2.86 - 3.30 |
0.0173 times |
Fri 28 November 2025 |
3.10 (-0.96%) |
3.15 |
2.64 - 3.15 |
0.0171 times |
Fri 21 November 2025 |
3.13 (702.56%) |
0.42 |
0.32 - 3.63 |
0.2186 times |
Fri 14 November 2025 |
0.39 (-11.36%) |
0.44 |
0.38 - 0.54 |
1.3648 times |
Fri 07 November 2025 |
0.44 (-20%) |
0.48 |
0.40 - 0.51 |
0.2434 times |
Fri 31 October 2025 |
0.55 (0%) |
0.63 |
0.54 - 0.65 |
0.3018 times |
Fri 31 October 2025 |
0.55 (3.77%) |
0.55 |
0.53 - 0.75 |
1.8168 times |
Fri 24 October 2025 |
0.53 (6%) |
0.50 |
0.42 - 0.63 |
1.5316 times |
Fri 17 October 2025 |
0.50 (-3.85%) |
0.53 |
0.48 - 0.63 |
0.5969 times |
Fri 10 October 2025 |
0.52 (-14.75%) |
0.58 |
0.51 - 0.86 |
3.8917 times |
Fri 03 October 2025 |
0.61 (56.41%) |
0.39 |
0.33 - 0.78 |
35.5554 times |
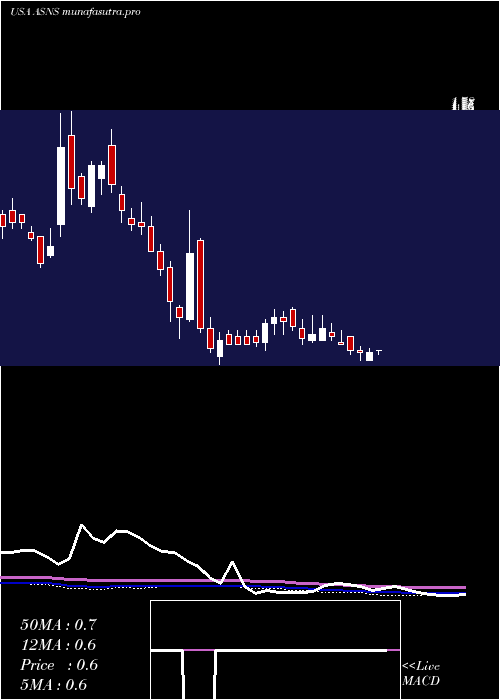
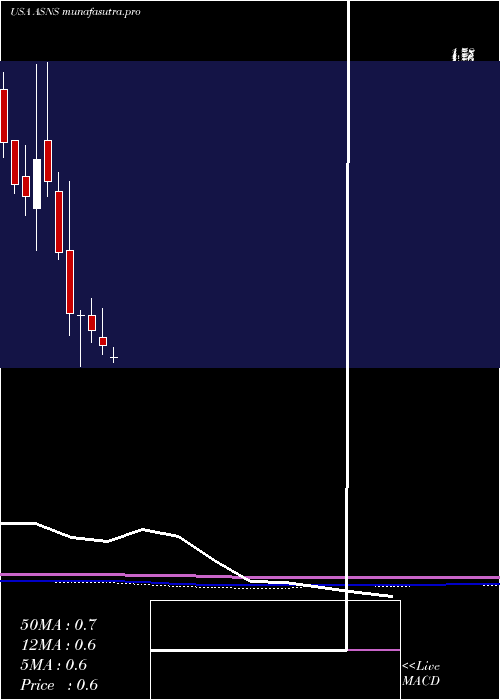
Monthly price and charts ArsanisInc Strong monthly Stock price targets for ArsanisInc ASNS are 3.02 and 3.46 | Monthly Target 1 | 2.67 | | Monthly Target 2 | 2.92 | | Monthly Target 3 | 3.11 | | Monthly Target 4 | 3.36 | | Monthly Target 5 | 3.55 |
Monthly price and volumes Arsanis Inc
| Date |
Closing |
Open |
Range |
Volume |
Thu 04 December 2025 |
3.17 (2.26%) |
3.04 |
2.86 - 3.30 |
0.0027 times |
Fri 28 November 2025 |
3.10 (463.64%) |
0.48 |
0.32 - 3.63 |
0.2833 times |
Fri 31 October 2025 |
0.55 (48.65%) |
0.39 |
0.33 - 0.86 |
6.7 times |
Tue 30 September 2025 |
0.37 (2.78%) |
0.60 |
0.36 - 0.63 |
2.4807 times |
Fri 29 August 2025 |
0.36 (-28%) |
0.49 |
0.34 - 0.66 |
0.2324 times |
Thu 31 July 2025 |
0.50 (-19.35%) |
0.57 |
0.48 - 0.61 |
0.0433 times |
Mon 30 June 2025 |
0.62 (-8.82%) |
0.65 |
0.58 - 0.77 |
0.0374 times |
Fri 30 May 2025 |
0.68 (-8.11%) |
0.74 |
0.63 - 0.81 |
0.0908 times |
Wed 30 April 2025 |
0.74 (-1.33%) |
0.74 |
0.53 - 0.76 |
0.0286 times |
Mon 31 March 2025 |
0.75 (-25%) |
1.01 |
0.66 - 1.29 |
0.1008 times |
Fri 28 February 2025 |
1.00 (-22.48%) |
1.25 |
0.97 - 1.33 |
0.0585 times |
DMA SMA EMA moving averages of Arsanis Inc ASNS
DMA (daily moving average) of Arsanis Inc ASNS
| DMA period | DMA value | | 5 day DMA | 3.06 | | 12 day DMA | 3.05 | | 20 day DMA | 2 | | 35 day DMA | 1.37 | | 50 day DMA | 1.12 | | 100 day DMA | 0.8 | | 150 day DMA | 0.76 | | 200 day DMA | 0.77 | EMA (exponential moving average) of Arsanis Inc ASNS
| EMA period | EMA current | EMA prev | EMA prev2 | | 5 day EMA | 3.03 | 2.96 | 2.99 | | 12 day EMA | 2.68 | 2.59 | 2.54 | | 20 day EMA | 2.27 | 2.17 | 2.09 | | 35 day EMA | 1.75 | 1.67 | 1.6 | | 50 day EMA | 1.26 | 1.18 | 1.11 |
SMA (simple moving average) of Arsanis Inc ASNS
| SMA period | SMA current | SMA prev | SMA prev2 | | 5 day SMA | 3.06 | 3.01 | 2.99 | | 12 day SMA | 3.05 | 2.81 | 2.6 | | 20 day SMA | 2 | 1.86 | 1.74 | | 35 day SMA | 1.37 | 1.29 | 1.23 | | 50 day SMA | 1.12 | 1.06 | 1.01 | | 100 day SMA | 0.8 | 0.77 | 0.75 | | 150 day SMA | 0.76 | 0.74 | 0.73 | | 200 day SMA | 0.77 | 0.76 | 0.75 |
|
|
