AsgnIncorporated ASGN full analysis,charts,indicators,moving averages,SMA,DMA,EMA,ADX,MACD,RSIAsgn Incorporated ASGN WideScreen charts, DMA,SMA,EMA technical analysis, forecast prediction, by indicators ADX,MACD,RSI,CCI USA stock exchange
operates under Technology sector & deals in Professional Services
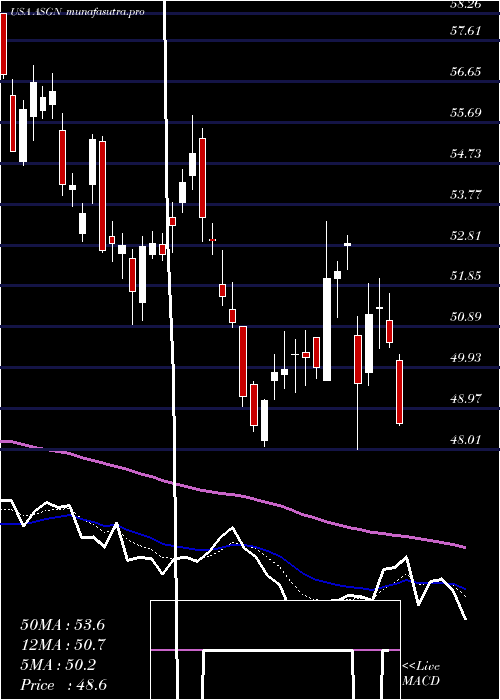
Daily price and charts and targets AsgnIncorporated Strong Daily Stock price targets for AsgnIncorporated ASGN are 45.49 and 46.64 | Daily Target 1 | 44.61 | | Daily Target 2 | 45.22 | | Daily Target 3 | 45.763333333333 | | Daily Target 4 | 46.37 | | Daily Target 5 | 46.91 |
Daily price and volume Asgn Incorporated
| Date |
Closing |
Open |
Range |
Volume |
Thu 04 December 2025 |
45.82 (0.86%) |
45.69 |
45.16 - 46.31 |
0.8323 times |
Wed 03 December 2025 |
45.43 (-0.04%) |
45.66 |
45.20 - 46.56 |
0.9128 times |
Tue 02 December 2025 |
45.45 (0.15%) |
45.53 |
45.14 - 46.03 |
0.6969 times |
Mon 01 December 2025 |
45.38 (0.82%) |
44.85 |
44.65 - 46.01 |
0.9581 times |
Fri 28 November 2025 |
45.01 (-0.6%) |
45.32 |
44.94 - 45.85 |
0.4682 times |
Wed 26 November 2025 |
45.28 (-0.7%) |
45.36 |
45.12 - 45.76 |
0.678 times |
Tue 25 November 2025 |
45.60 (2.33%) |
44.73 |
44.53 - 46.49 |
1.3527 times |
Mon 24 November 2025 |
44.56 (3.65%) |
42.87 |
42.56 - 44.59 |
1.5312 times |
Fri 21 November 2025 |
42.99 (7.45%) |
40.80 |
40.56 - 43.91 |
1.3034 times |
Thu 20 November 2025 |
40.01 (-1.06%) |
40.60 |
39.25 - 41.43 |
1.2664 times |
Wed 19 November 2025 |
40.44 (-2.2%) |
41.31 |
40.24 - 41.43 |
0.7087 times |
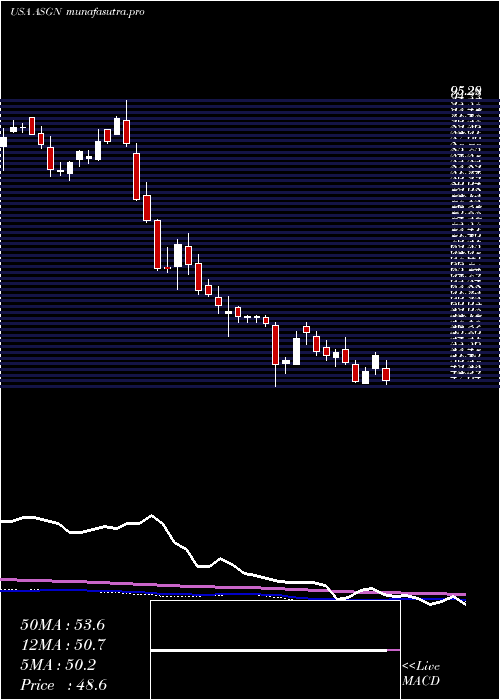
Weekly price and charts AsgnIncorporated Strong weekly Stock price targets for AsgnIncorporated ASGN are 45.24 and 47.15 | Weekly Target 1 | 43.77 | | Weekly Target 2 | 44.79 | | Weekly Target 3 | 45.676666666667 | | Weekly Target 4 | 46.7 | | Weekly Target 5 | 47.59 |
Weekly price and volumes for Asgn Incorporated
| Date |
Closing |
Open |
Range |
Volume |
Thu 04 December 2025 |
45.82 (1.8%) |
44.85 |
44.65 - 46.56 |
0.8225 times |
Fri 28 November 2025 |
45.01 (4.7%) |
42.87 |
42.56 - 46.49 |
0.9749 times |
Fri 21 November 2025 |
42.99 (0.51%) |
42.66 |
39.25 - 43.91 |
1.1621 times |
Fri 14 November 2025 |
42.77 (-2.08%) |
43.98 |
42.61 - 46.03 |
1.0734 times |
Fri 07 November 2025 |
43.68 (-2.41%) |
44.17 |
42.90 - 45.49 |
1.0964 times |
Fri 31 October 2025 |
44.76 (0%) |
43.51 |
43.25 - 44.89 |
0.2738 times |
Fri 31 October 2025 |
44.76 (-3.72%) |
46.85 |
43.25 - 47.00 |
1.1377 times |
Fri 24 October 2025 |
46.49 (0.89%) |
46.41 |
42.77 - 48.68 |
1.5546 times |
Fri 17 October 2025 |
46.08 (1.48%) |
45.41 |
45.10 - 48.16 |
0.9955 times |
Fri 10 October 2025 |
45.41 (-6.62%) |
48.95 |
45.30 - 49.30 |
0.9091 times |
Fri 03 October 2025 |
48.63 (1.59%) |
48.04 |
46.51 - 49.05 |
1.0162 times |
Monthly price and charts AsgnIncorporated Strong monthly Stock price targets for AsgnIncorporated ASGN are 45.24 and 47.15 | Monthly Target 1 | 43.77 | | Monthly Target 2 | 44.79 | | Monthly Target 3 | 45.676666666667 | | Monthly Target 4 | 46.7 | | Monthly Target 5 | 47.59 |
Monthly price and volumes Asgn Incorporated
| Date |
Closing |
Open |
Range |
Volume |
Thu 04 December 2025 |
45.82 (1.8%) |
44.85 |
44.65 - 46.56 |
0.2012 times |
Fri 28 November 2025 |
45.01 (0.56%) |
44.17 |
39.25 - 46.49 |
1.0534 times |
Fri 31 October 2025 |
44.76 (-5.47%) |
47.23 |
42.77 - 49.30 |
1.3288 times |
Tue 30 September 2025 |
47.35 (-12.72%) |
53.50 |
46.51 - 54.89 |
1.2083 times |
Fri 29 August 2025 |
54.25 (8.2%) |
50.55 |
48.38 - 54.82 |
1.0399 times |
Thu 31 July 2025 |
50.14 (0.42%) |
49.63 |
46.64 - 60.75 |
1.2861 times |
Mon 30 June 2025 |
49.93 (-5.45%) |
52.49 |
48.09 - 55.86 |
0.8794 times |
Fri 30 May 2025 |
52.81 (4.82%) |
50.40 |
49.85 - 58.36 |
0.9444 times |
Wed 30 April 2025 |
50.38 (-20.06%) |
62.62 |
47.64 - 64.29 |
1.0475 times |
Mon 31 March 2025 |
63.02 (-6.47%) |
67.62 |
61.70 - 73.13 |
1.011 times |
Fri 28 February 2025 |
67.38 (-23.61%) |
86.46 |
66.69 - 88.15 |
1.0875 times |
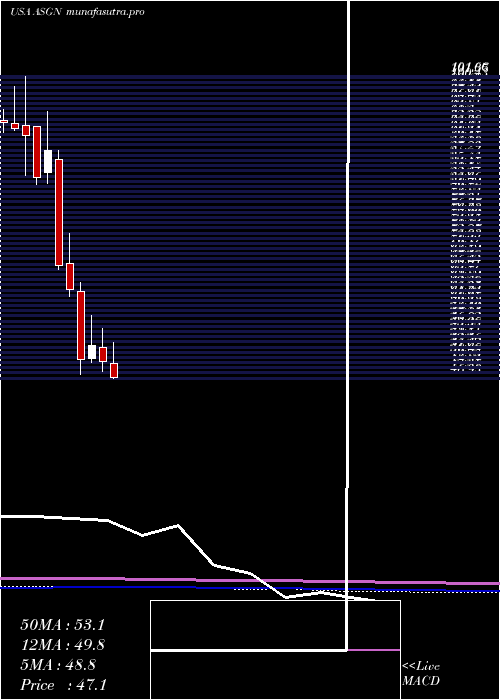
DMA SMA EMA moving averages of Asgn Incorporated ASGN
DMA (daily moving average) of Asgn Incorporated ASGN
| DMA period | DMA value | | 5 day DMA | 45.42 | | 12 day DMA | 43.94 | | 20 day DMA | 43.86 | | 35 day DMA | 44.62 | | 50 day DMA | 45.51 | | 100 day DMA | 48.5 | | 150 day DMA | 49.85 | | 200 day DMA | 53.16 | EMA (exponential moving average) of Asgn Incorporated ASGN
| EMA period | EMA current | EMA prev | EMA prev2 | | 5 day EMA | 45.37 | 45.14 | 45 | | 12 day EMA | 44.69 | 44.48 | 44.31 | | 20 day EMA | 44.55 | 44.42 | 44.31 | | 35 day EMA | 45.06 | 45.01 | 44.99 | | 50 day EMA | 45.84 | 45.84 | 45.86 |
SMA (simple moving average) of Asgn Incorporated ASGN
| SMA period | SMA current | SMA prev | SMA prev2 | | 5 day SMA | 45.42 | 45.31 | 45.34 | | 12 day SMA | 43.94 | 43.59 | 43.37 | | 20 day SMA | 43.86 | 43.81 | 43.76 | | 35 day SMA | 44.62 | 44.63 | 44.7 | | 50 day SMA | 45.51 | 45.58 | 45.64 | | 100 day SMA | 48.5 | 48.51 | 48.54 | | 150 day SMA | 49.85 | 49.88 | 49.92 | | 200 day SMA | 53.16 | 53.29 | 53.44 |
|
|
