AssociatedBanc ASB full analysis,charts,indicators,moving averages,SMA,DMA,EMA,ADX,MACD,RSIAssociated Banc ASB WideScreen charts, DMA,SMA,EMA technical analysis, forecast prediction, by indicators ADX,MACD,RSI,CCI USA stock exchange
operates under Finance sector & deals in Major Banks
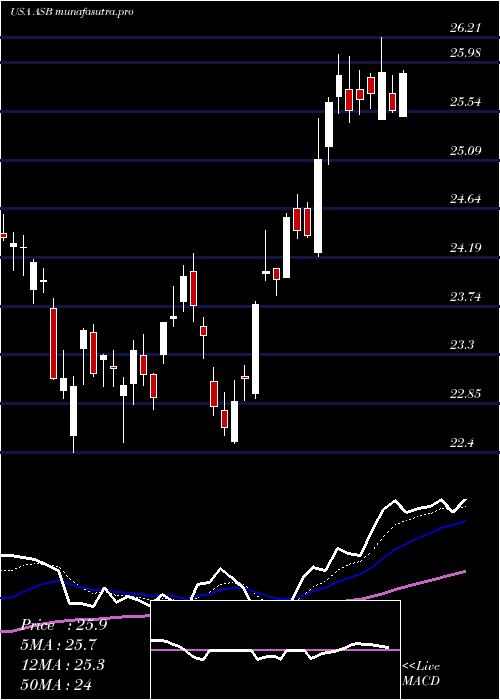
Daily price and charts and targets AssociatedBanc Strong Daily Stock price targets for AssociatedBanc ASB are 25.25 and 25.58 | Daily Target 1 | 24.99 | | Daily Target 2 | 25.17 | | Daily Target 3 | 25.32 | | Daily Target 4 | 25.5 | | Daily Target 5 | 25.65 |
Daily price and volume Associated Banc
| Date |
Closing |
Open |
Range |
Volume |
Tue 21 October 2025 |
25.35 (0.12%) |
25.14 |
25.14 - 25.47 |
0.8428 times |
Mon 20 October 2025 |
25.32 (3.94%) |
24.57 |
24.39 - 25.38 |
0.8278 times |
Fri 17 October 2025 |
24.36 (1.04%) |
24.38 |
24.10 - 24.57 |
1.315 times |
Thu 16 October 2025 |
24.11 (-5.64%) |
25.44 |
23.86 - 25.45 |
1.1819 times |
Wed 15 October 2025 |
25.55 (-3.11%) |
26.40 |
25.44 - 26.45 |
0.8771 times |
Tue 14 October 2025 |
26.37 (3.94%) |
25.26 |
25.18 - 26.55 |
0.8335 times |
Mon 13 October 2025 |
25.37 (2.8%) |
25.08 |
24.94 - 25.39 |
0.663 times |
Fri 10 October 2025 |
24.68 (-5.84%) |
26.23 |
24.66 - 26.41 |
1.8398 times |
Thu 09 October 2025 |
26.21 (0.42%) |
26.05 |
25.87 - 26.34 |
0.9042 times |
Wed 08 October 2025 |
26.10 (-1.62%) |
26.87 |
26.08 - 26.87 |
0.7149 times |
Tue 07 October 2025 |
26.53 (-0.26%) |
26.65 |
26.43 - 26.88 |
0.8147 times |
Weekly price and charts AssociatedBanc Strong weekly Stock price targets for AssociatedBanc ASB are 24.87 and 25.95 | Weekly Target 1 | 23.99 | | Weekly Target 2 | 24.67 | | Weekly Target 3 | 25.07 | | Weekly Target 4 | 25.75 | | Weekly Target 5 | 26.15 |
Weekly price and volumes for Associated Banc
| Date |
Closing |
Open |
Range |
Volume |
Tue 21 October 2025 |
25.35 (4.06%) |
24.57 |
24.39 - 25.47 |
0.4741 times |
Fri 17 October 2025 |
24.36 (-1.3%) |
25.08 |
23.86 - 26.55 |
1.3824 times |
Fri 10 October 2025 |
24.68 (-5.08%) |
26.28 |
24.66 - 26.88 |
1.4419 times |
Fri 03 October 2025 |
26.00 (-0.23%) |
26.07 |
25.18 - 26.18 |
1.0777 times |
Fri 26 September 2025 |
26.06 (-0.8%) |
26.20 |
25.49 - 26.33 |
1.0478 times |
Fri 19 September 2025 |
26.27 (0.08%) |
26.33 |
25.34 - 26.64 |
1.2396 times |
Fri 12 September 2025 |
26.25 (-1.46%) |
26.54 |
25.99 - 26.65 |
1.1971 times |
Fri 05 September 2025 |
26.64 (-1.22%) |
26.35 |
26.03 - 27.04 |
0.8261 times |
Fri 29 August 2025 |
26.97 (0%) |
27.24 |
26.92 - 27.46 |
0.3016 times |
Fri 29 August 2025 |
26.97 (1.81%) |
26.44 |
26.32 - 27.46 |
1.0117 times |
Fri 22 August 2025 |
26.49 (6.6%) |
24.80 |
24.66 - 26.62 |
0.8479 times |
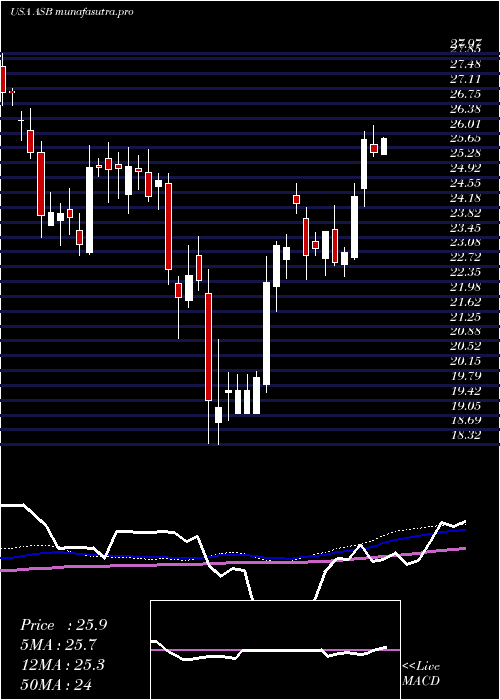
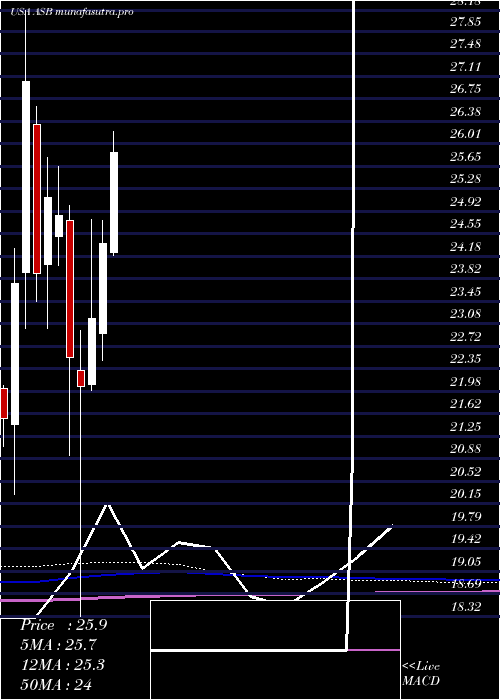
Monthly price and charts AssociatedBanc Strong monthly Stock price targets for AssociatedBanc ASB are 23.1 and 26.12 | Monthly Target 1 | 22.34 | | Monthly Target 2 | 23.85 | | Monthly Target 3 | 25.363333333333 | | Monthly Target 4 | 26.87 | | Monthly Target 5 | 28.38 |
Monthly price and volumes Associated Banc
| Date |
Closing |
Open |
Range |
Volume |
Tue 21 October 2025 |
25.35 (-1.4%) |
25.51 |
23.86 - 26.88 |
0.7791 times |
Tue 30 September 2025 |
25.71 (-4.67%) |
26.35 |
25.26 - 27.04 |
0.9903 times |
Fri 29 August 2025 |
26.97 (9.01%) |
24.21 |
23.63 - 27.46 |
0.9235 times |
Thu 31 July 2025 |
24.74 (1.44%) |
24.24 |
24.20 - 26.21 |
1.2463 times |
Mon 30 June 2025 |
24.39 (5.27%) |
22.92 |
22.48 - 24.77 |
0.7438 times |
Fri 30 May 2025 |
23.17 (5.03%) |
22.10 |
22.00 - 24.78 |
0.7764 times |
Wed 30 April 2025 |
22.06 (-2.09%) |
22.32 |
18.32 - 22.97 |
1.3763 times |
Mon 31 March 2025 |
22.53 (-9.34%) |
24.76 |
20.94 - 25.01 |
1.088 times |
Fri 28 February 2025 |
24.85 (-1.15%) |
24.50 |
24.04 - 25.65 |
0.8179 times |
Fri 31 January 2025 |
25.14 (5.19%) |
24.05 |
23.00 - 25.79 |
1.2582 times |
Tue 31 December 2024 |
23.90 (-11.58%) |
26.33 |
23.44 - 26.62 |
0.7305 times |
DMA SMA EMA moving averages of Associated Banc ASB
DMA (daily moving average) of Associated Banc ASB
| DMA period | DMA value | | 5 day DMA | 24.94 | | 12 day DMA | 25.55 | | 20 day DMA | 25.66 | | 35 day DMA | 25.89 | | 50 day DMA | 25.93 | | 100 day DMA | 25.21 | | 150 day DMA | 24.13 | | 200 day DMA | 24.17 | EMA (exponential moving average) of Associated Banc ASB
| EMA period | EMA current | EMA prev | EMA prev2 | | 5 day EMA | 25.15 | 25.05 | 24.92 | | 12 day EMA | 25.37 | 25.37 | 25.38 | | 20 day EMA | 25.54 | 25.56 | 25.58 | | 35 day EMA | 25.62 | 25.64 | 25.66 | | 50 day EMA | 25.68 | 25.69 | 25.71 |
SMA (simple moving average) of Associated Banc ASB
| SMA period | SMA current | SMA prev | SMA prev2 | | 5 day SMA | 24.94 | 25.14 | 25.15 | | 12 day SMA | 25.55 | 25.6 | 25.63 | | 20 day SMA | 25.66 | 25.68 | 25.7 | | 35 day SMA | 25.89 | 25.92 | 25.97 | | 50 day SMA | 25.93 | 25.92 | 25.89 | | 100 day SMA | 25.21 | 25.18 | 25.17 | | 150 day SMA | 24.13 | 24.11 | 24.09 | | 200 day SMA | 24.17 | 24.16 | 24.15 |
|
|
