ArtesianResources ARTNA full analysis,charts,indicators,moving averages,SMA,DMA,EMA,ADX,MACD,RSIArtesian Resources ARTNA WideScreen charts, DMA,SMA,EMA technical analysis, forecast prediction, by indicators ADX,MACD,RSI,CCI USA stock exchange
operates under Public Utilities sector & deals in Water Supply
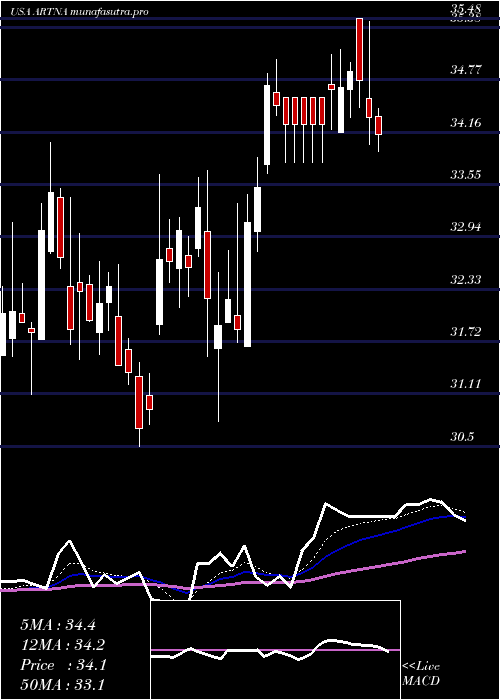
Daily price and charts and targets ArtesianResources Strong Daily Stock price targets for ArtesianResources ARTNA are 32.5 and 33.55 | Daily Target 1 | 32.28 | | Daily Target 2 | 32.72 | | Daily Target 3 | 33.33 | | Daily Target 4 | 33.77 | | Daily Target 5 | 34.38 |
Daily price and volume Artesian Resources
| Date |
Closing |
Open |
Range |
Volume |
Tue 21 October 2025 |
33.16 (-2.18%) |
33.75 |
32.89 - 33.94 |
1.1599 times |
Mon 20 October 2025 |
33.90 (1.01%) |
33.55 |
33.51 - 33.91 |
0.625 times |
Fri 17 October 2025 |
33.56 (0.18%) |
33.70 |
33.32 - 33.81 |
1.1839 times |
Thu 16 October 2025 |
33.50 (0.6%) |
33.25 |
33.22 - 33.67 |
1.3522 times |
Wed 15 October 2025 |
33.30 (2.08%) |
32.85 |
32.83 - 33.30 |
0.7752 times |
Tue 14 October 2025 |
32.62 (-0.31%) |
32.68 |
32.56 - 32.95 |
0.7452 times |
Mon 13 October 2025 |
32.72 (-2.33%) |
33.57 |
32.59 - 33.70 |
1.2921 times |
Fri 10 October 2025 |
33.50 (1.42%) |
33.10 |
33.00 - 33.50 |
1.232 times |
Thu 09 October 2025 |
33.03 (0.79%) |
32.80 |
32.54 - 33.03 |
1.0216 times |
Wed 08 October 2025 |
32.77 (-0.06%) |
32.50 |
32.48 - 32.89 |
0.613 times |
Tue 07 October 2025 |
32.79 (1.52%) |
32.50 |
32.05 - 32.93 |
1.5505 times |
Weekly price and charts ArtesianResources Strong weekly Stock price targets for ArtesianResources ARTNA are 32.5 and 33.55 | Weekly Target 1 | 32.28 | | Weekly Target 2 | 32.72 | | Weekly Target 3 | 33.33 | | Weekly Target 4 | 33.77 | | Weekly Target 5 | 34.38 |
Weekly price and volumes for Artesian Resources
| Date |
Closing |
Open |
Range |
Volume |
Tue 21 October 2025 |
33.16 (-1.19%) |
33.55 |
32.89 - 33.94 |
0.2566 times |
Fri 17 October 2025 |
33.56 (0.18%) |
33.57 |
32.56 - 33.81 |
0.7691 times |
Fri 10 October 2025 |
33.50 (4.98%) |
32.18 |
31.98 - 33.50 |
0.8399 times |
Fri 03 October 2025 |
31.91 (-1.72%) |
32.51 |
31.70 - 32.86 |
0.8647 times |
Fri 26 September 2025 |
32.47 (2.79%) |
31.95 |
31.95 - 33.40 |
0.9998 times |
Fri 19 September 2025 |
31.59 (-4.24%) |
33.05 |
31.50 - 33.19 |
3.1142 times |
Fri 12 September 2025 |
32.99 (-0.75%) |
33.17 |
32.50 - 33.49 |
0.9713 times |
Fri 05 September 2025 |
33.24 (0.27%) |
33.27 |
32.45 - 33.32 |
0.839 times |
Fri 29 August 2025 |
33.15 (0%) |
33.45 |
33.06 - 33.98 |
0.21 times |
Fri 29 August 2025 |
33.15 (-2.04%) |
33.89 |
33.00 - 34.28 |
1.1354 times |
Fri 22 August 2025 |
33.84 (3.23%) |
32.78 |
32.57 - 34.15 |
0.7181 times |
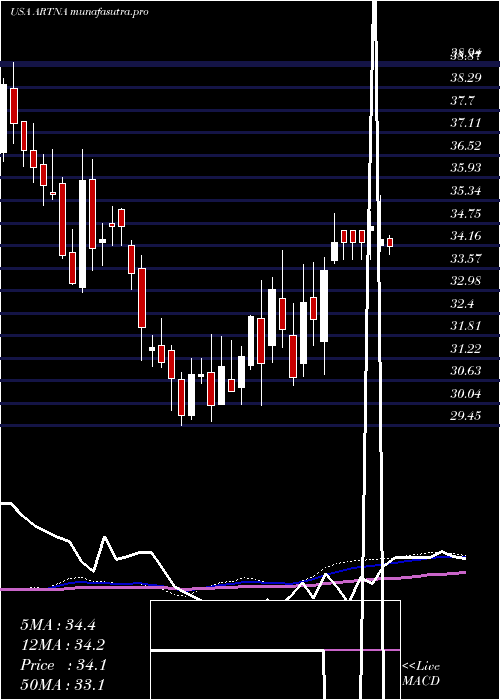
Monthly price and charts ArtesianResources Strong monthly Stock price targets for ArtesianResources ARTNA are 32.43 and 34.67 | Monthly Target 1 | 30.69 | | Monthly Target 2 | 31.93 | | Monthly Target 3 | 32.933333333333 | | Monthly Target 4 | 34.17 | | Monthly Target 5 | 35.17 |
Monthly price and volumes Artesian Resources
| Date |
Closing |
Open |
Range |
Volume |
Tue 21 October 2025 |
33.16 (1.72%) |
32.46 |
31.70 - 33.94 |
0.4183 times |
Tue 30 September 2025 |
32.60 (-1.66%) |
33.27 |
31.50 - 33.49 |
1.0503 times |
Fri 29 August 2025 |
33.15 (1.53%) |
32.80 |
32.46 - 34.33 |
0.8738 times |
Thu 31 July 2025 |
32.65 (-2.71%) |
33.60 |
32.25 - 34.38 |
0.9124 times |
Mon 30 June 2025 |
33.56 (-2.7%) |
34.45 |
32.75 - 34.88 |
0.8471 times |
Fri 30 May 2025 |
34.49 (-2.9%) |
35.63 |
32.22 - 36.19 |
1.0424 times |
Wed 30 April 2025 |
35.52 (8.79%) |
32.57 |
30.79 - 35.99 |
1.111 times |
Mon 31 March 2025 |
32.65 (5.02%) |
31.56 |
30.50 - 34.04 |
1.4377 times |
Fri 28 February 2025 |
31.09 (0.29%) |
30.67 |
29.97 - 33.24 |
0.9858 times |
Fri 31 January 2025 |
31.00 (-1.96%) |
32.00 |
29.45 - 32.25 |
1.3212 times |
Tue 31 December 2024 |
31.62 (-8.74%) |
34.17 |
30.99 - 34.29 |
1.0451 times |

DMA SMA EMA moving averages of Artesian Resources ARTNA
DMA (daily moving average) of Artesian Resources ARTNA
| DMA period | DMA value | | 5 day DMA | 33.48 | | 12 day DMA | 33.1 | | 20 day DMA | 32.76 | | 35 day DMA | 32.73 | | 50 day DMA | 32.88 | | 100 day DMA | 33.23 | | 150 day DMA | 33.37 | | 200 day DMA | 32.85 | EMA (exponential moving average) of Artesian Resources ARTNA
| EMA period | EMA current | EMA prev | EMA prev2 | | 5 day EMA | 33.38 | 33.49 | 33.28 | | 12 day EMA | 33.13 | 33.12 | 32.98 | | 20 day EMA | 32.98 | 32.96 | 32.86 | | 35 day EMA | 32.95 | 32.94 | 32.88 | | 50 day EMA | 33 | 32.99 | 32.95 |
SMA (simple moving average) of Artesian Resources ARTNA
| SMA period | SMA current | SMA prev | SMA prev2 | | 5 day SMA | 33.48 | 33.38 | 33.14 | | 12 day SMA | 33.1 | 32.99 | 32.83 | | 20 day SMA | 32.76 | 32.76 | 32.68 | | 35 day SMA | 32.73 | 32.72 | 32.7 | | 50 day SMA | 32.88 | 32.89 | 32.89 | | 100 day SMA | 33.23 | 33.23 | 33.24 | | 150 day SMA | 33.37 | 33.36 | 33.35 | | 200 day SMA | 32.85 | 32.84 | 32.82 |
|
|
