AlexandriaReal ARE full analysis,charts,indicators,moving averages,SMA,DMA,EMA,ADX,MACD,RSIAlexandria Real ARE WideScreen charts, DMA,SMA,EMA technical analysis, forecast prediction, by indicators ADX,MACD,RSI,CCI USA stock exchange
operates under Consumer Services sector & deals in Real Estate Investment Trusts
Daily price and charts and targets AlexandriaReal Strong Daily Stock price targets for AlexandriaReal ARE are 45.1 and 47.58 | Daily Target 1 | 44.61 | | Daily Target 2 | 45.59 | | Daily Target 3 | 47.086666666667 | | Daily Target 4 | 48.07 | | Daily Target 5 | 49.57 |
Daily price and volume Alexandria Real
| Date |
Closing |
Open |
Range |
Volume |
Thu 04 December 2025 |
46.58 (-3.8%) |
48.50 |
46.10 - 48.58 |
1.1137 times |
Wed 03 December 2025 |
48.42 (-10.05%) |
52.13 |
47.57 - 52.57 |
2.5368 times |
Tue 02 December 2025 |
53.83 (1.37%) |
53.31 |
52.96 - 54.17 |
0.7279 times |
Mon 01 December 2025 |
53.10 (-1.06%) |
52.86 |
52.39 - 53.60 |
0.9766 times |
Fri 28 November 2025 |
53.67 (0.19%) |
53.53 |
53.40 - 54.45 |
0.3621 times |
Wed 26 November 2025 |
53.57 (1.75%) |
52.29 |
52.27 - 54.17 |
0.7835 times |
Tue 25 November 2025 |
52.65 (2.79%) |
51.60 |
51.55 - 52.88 |
0.6659 times |
Mon 24 November 2025 |
51.22 (0.65%) |
51.00 |
50.60 - 51.58 |
1.0082 times |
Fri 21 November 2025 |
50.89 (4.15%) |
49.06 |
48.99 - 51.75 |
0.9663 times |
Thu 20 November 2025 |
48.86 (-1.31%) |
49.82 |
48.66 - 50.46 |
0.859 times |
Wed 19 November 2025 |
49.51 (-2.54%) |
50.80 |
49.30 - 51.00 |
0.93 times |
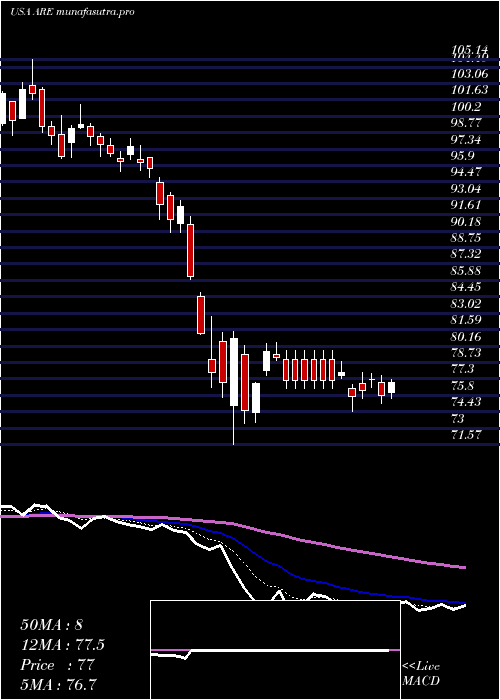
Weekly price and charts AlexandriaReal Strong weekly Stock price targets for AlexandriaReal ARE are 42.31 and 50.38 | Weekly Target 1 | 40.88 | | Weekly Target 2 | 43.73 | | Weekly Target 3 | 48.95 | | Weekly Target 4 | 51.8 | | Weekly Target 5 | 57.02 |
Weekly price and volumes for Alexandria Real
| Date |
Closing |
Open |
Range |
Volume |
Thu 04 December 2025 |
46.58 (-13.21%) |
52.86 |
46.10 - 54.17 |
1.2679 times |
Fri 28 November 2025 |
53.67 (5.46%) |
51.00 |
50.60 - 54.45 |
0.6676 times |
Fri 21 November 2025 |
50.89 (-2.68%) |
52.34 |
48.66 - 52.54 |
1.1515 times |
Fri 14 November 2025 |
52.29 (-5.97%) |
55.87 |
51.63 - 56.35 |
0.9193 times |
Fri 07 November 2025 |
55.61 (-4.48%) |
55.04 |
52.94 - 55.71 |
0.8173 times |
Fri 31 October 2025 |
58.22 (0%) |
56.00 |
55.30 - 58.70 |
0.34 times |
Fri 31 October 2025 |
58.22 (-24.79%) |
77.93 |
55.02 - 78.00 |
2.6553 times |
Fri 24 October 2025 |
77.41 (3.23%) |
75.27 |
75.24 - 78.51 |
0.5044 times |
Fri 17 October 2025 |
74.99 (1.45%) |
73.88 |
72.83 - 78.54 |
0.5801 times |
Fri 10 October 2025 |
73.92 (-11.79%) |
84.15 |
72.90 - 84.30 |
1.0965 times |
Fri 03 October 2025 |
83.80 (-0.06%) |
84.34 |
81.47 - 85.37 |
0.5611 times |
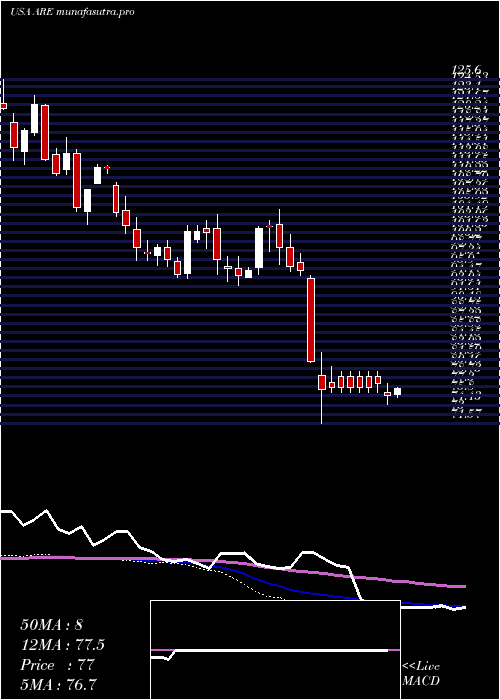
Monthly price and charts AlexandriaReal Strong monthly Stock price targets for AlexandriaReal ARE are 42.31 and 50.38 | Monthly Target 1 | 40.88 | | Monthly Target 2 | 43.73 | | Monthly Target 3 | 48.95 | | Monthly Target 4 | 51.8 | | Monthly Target 5 | 57.02 |
Monthly price and volumes Alexandria Real
| Date |
Closing |
Open |
Range |
Volume |
Thu 04 December 2025 |
46.58 (-13.21%) |
52.86 |
46.10 - 54.17 |
0.4337 times |
Fri 28 November 2025 |
53.67 (-7.82%) |
55.04 |
48.66 - 56.35 |
1.2162 times |
Fri 31 October 2025 |
58.22 (-30.14%) |
82.11 |
55.02 - 85.37 |
1.8853 times |
Tue 30 September 2025 |
83.34 (1.09%) |
81.39 |
80.26 - 88.24 |
0.7824 times |
Fri 29 August 2025 |
82.44 (7.86%) |
76.72 |
71.55 - 82.69 |
0.8157 times |
Thu 31 July 2025 |
76.43 (5.23%) |
72.28 |
72.05 - 83.36 |
1.0333 times |
Mon 30 June 2025 |
72.63 (3.48%) |
70.00 |
68.30 - 75.80 |
0.926 times |
Fri 30 May 2025 |
70.19 (-3.4%) |
73.00 |
67.37 - 76.75 |
1.0563 times |
Wed 30 April 2025 |
72.66 (-21.46%) |
93.28 |
70.57 - 93.54 |
1.2167 times |
Mon 31 March 2025 |
92.51 (-9.53%) |
102.53 |
91.15 - 105.14 |
0.6345 times |
Fri 28 February 2025 |
102.26 (5.04%) |
96.24 |
93.25 - 102.55 |
0.6109 times |

DMA SMA EMA moving averages of Alexandria Real ARE
DMA (daily moving average) of Alexandria Real ARE
| DMA period | DMA value | | 5 day DMA | 51.12 | | 12 day DMA | 51.09 | | 20 day DMA | 52.01 | | 35 day DMA | 58.77 | | 50 day DMA | 65.01 | | 100 day DMA | 72.75 | | 150 day DMA | 72.83 | | 200 day DMA | 76.79 | EMA (exponential moving average) of Alexandria Real ARE
| EMA period | EMA current | EMA prev | EMA prev2 | | 5 day EMA | 49.91 | 51.57 | 53.14 | | 12 day EMA | 51.47 | 52.36 | 53.08 | | 20 day EMA | 53.64 | 54.38 | 55.01 | | 35 day EMA | 59.25 | 60 | 60.68 | | 50 day EMA | 65.36 | 66.13 | 66.85 |
SMA (simple moving average) of Alexandria Real ARE
| SMA period | SMA current | SMA prev | SMA prev2 | | 5 day SMA | 51.12 | 52.52 | 53.36 | | 12 day SMA | 51.09 | 51.45 | 51.77 | | 20 day SMA | 52.01 | 52.4 | 52.68 | | 35 day SMA | 58.77 | 59.61 | 60.37 | | 50 day SMA | 65.01 | 65.79 | 66.56 | | 100 day SMA | 72.75 | 73.06 | 73.36 | | 150 day SMA | 72.83 | 73 | 73.16 | | 200 day SMA | 76.79 | 77.03 | 77.27 |
|
|
