AnteroResources AR full analysis,charts,indicators,moving averages,SMA,DMA,EMA,ADX,MACD,RSIAntero Resources AR WideScreen charts, DMA,SMA,EMA technical analysis, forecast prediction, by indicators ADX,MACD,RSI,CCI USA stock exchange
operates under Energy sector & deals in Oil Gas Production
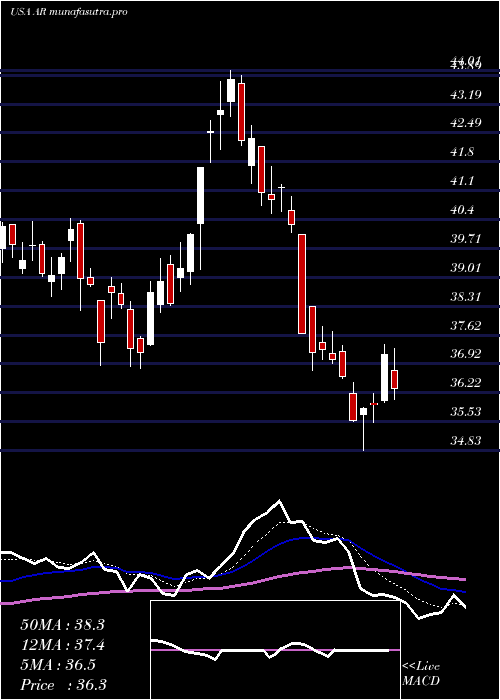
Daily price and charts and targets AnteroResources Strong Daily Stock price targets for AnteroResources AR are 36.38 and 37.34 | Daily Target 1 | 35.67 | | Daily Target 2 | 36.13 | | Daily Target 3 | 36.63 | | Daily Target 4 | 37.09 | | Daily Target 5 | 37.59 |
Daily price and volume Antero Resources
| Date |
Closing |
Open |
Range |
Volume |
Thu 04 December 2025 |
36.59 (0.52%) |
36.40 |
36.17 - 37.13 |
0.4858 times |
Wed 03 December 2025 |
36.40 (4.84%) |
35.15 |
35.02 - 36.67 |
1.3637 times |
Tue 02 December 2025 |
34.72 (-2.91%) |
35.68 |
34.68 - 35.78 |
0.8214 times |
Mon 01 December 2025 |
35.76 (-1.84%) |
36.16 |
35.64 - 36.44 |
1.0715 times |
Fri 28 November 2025 |
36.43 (3.73%) |
35.60 |
35.28 - 36.67 |
0.5794 times |
Wed 26 November 2025 |
35.12 (3.29%) |
34.29 |
34.29 - 35.69 |
0.9464 times |
Tue 25 November 2025 |
34.00 (-1.59%) |
34.21 |
33.39 - 34.32 |
0.901 times |
Mon 24 November 2025 |
34.55 (2.98%) |
33.41 |
32.77 - 34.65 |
0.9298 times |
Fri 21 November 2025 |
33.55 (0.69%) |
33.33 |
32.68 - 33.90 |
1.2092 times |
Thu 20 November 2025 |
33.32 (-5.02%) |
35.11 |
33.27 - 35.93 |
1.6917 times |
Wed 19 November 2025 |
35.08 (0.92%) |
34.24 |
34.15 - 35.15 |
0.9068 times |
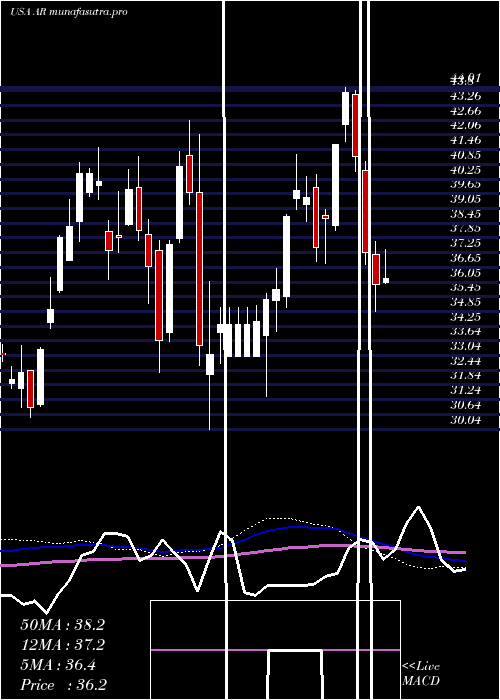
Weekly price and charts AnteroResources Strong weekly Stock price targets for AnteroResources AR are 35.64 and 38.09 | Weekly Target 1 | 33.68 | | Weekly Target 2 | 35.14 | | Weekly Target 3 | 36.133333333333 | | Weekly Target 4 | 37.59 | | Weekly Target 5 | 38.58 |
Weekly price and volumes for Antero Resources
| Date |
Closing |
Open |
Range |
Volume |
Thu 04 December 2025 |
36.59 (0.44%) |
36.16 |
34.68 - 37.13 |
0.9651 times |
Fri 28 November 2025 |
36.43 (8.58%) |
33.41 |
32.77 - 36.67 |
0.8657 times |
Fri 21 November 2025 |
33.55 (-2.36%) |
34.15 |
32.68 - 35.93 |
1.415 times |
Fri 14 November 2025 |
34.36 (2.11%) |
34.30 |
33.06 - 35.66 |
1.1602 times |
Fri 07 November 2025 |
33.65 (8.86%) |
32.60 |
32.00 - 33.82 |
0.8094 times |
Fri 31 October 2025 |
30.91 (0%) |
30.61 |
30.12 - 31.12 |
0.3584 times |
Fri 31 October 2025 |
30.91 (-5.45%) |
32.87 |
29.10 - 33.06 |
1.483 times |
Fri 24 October 2025 |
32.69 (6.21%) |
30.97 |
30.95 - 33.16 |
0.9276 times |
Fri 17 October 2025 |
30.78 (-2.59%) |
32.00 |
30.29 - 32.69 |
1.0418 times |
Fri 10 October 2025 |
31.60 (-5.16%) |
33.98 |
31.58 - 34.60 |
0.9739 times |
Fri 03 October 2025 |
33.32 (-2.32%) |
33.90 |
32.71 - 35.13 |
1.181 times |
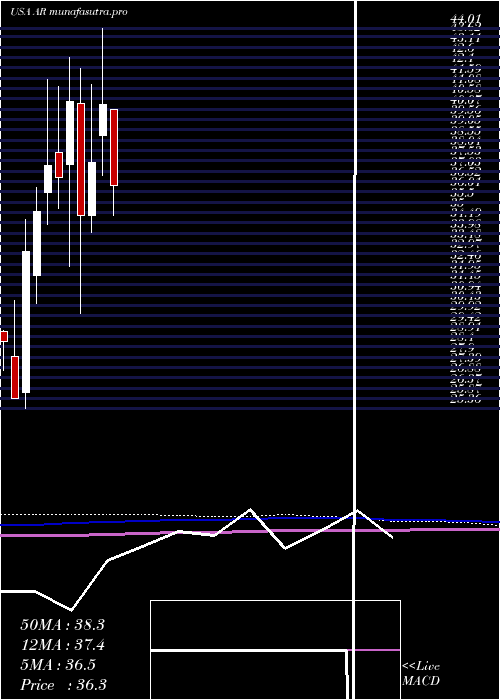
Monthly price and charts AnteroResources Strong monthly Stock price targets for AnteroResources AR are 35.64 and 38.09 | Monthly Target 1 | 33.68 | | Monthly Target 2 | 35.14 | | Monthly Target 3 | 36.133333333333 | | Monthly Target 4 | 37.59 | | Monthly Target 5 | 38.58 |
Monthly price and volumes Antero Resources
| Date |
Closing |
Open |
Range |
Volume |
Thu 04 December 2025 |
36.59 (0.44%) |
36.16 |
34.68 - 37.13 |
0.2014 times |
Fri 28 November 2025 |
36.43 (17.86%) |
32.60 |
32.00 - 36.67 |
0.887 times |
Fri 31 October 2025 |
30.91 (-7.9%) |
33.40 |
29.10 - 35.13 |
1.1524 times |
Tue 30 September 2025 |
33.56 (5.14%) |
31.61 |
31.18 - 34.68 |
1.0502 times |
Fri 29 August 2025 |
31.92 (-8.62%) |
34.46 |
29.72 - 34.60 |
1.0179 times |
Thu 31 July 2025 |
34.93 (-13.28%) |
40.05 |
32.10 - 40.05 |
1.4431 times |
Mon 30 June 2025 |
40.28 (7.56%) |
38.78 |
36.81 - 44.01 |
0.9105 times |
Fri 30 May 2025 |
37.45 (7.52%) |
34.85 |
34.02 - 41.27 |
0.9998 times |
Wed 30 April 2025 |
34.83 (-13.87%) |
40.35 |
30.04 - 42.09 |
1.356 times |
Mon 31 March 2025 |
40.44 (10.19%) |
37.34 |
32.37 - 42.63 |
0.9818 times |
Fri 28 February 2025 |
36.70 (-1.66%) |
37.96 |
35.18 - 41.18 |
0.9274 times |
DMA SMA EMA moving averages of Antero Resources AR
DMA (daily moving average) of Antero Resources AR
| DMA period | DMA value | | 5 day DMA | 35.98 | | 12 day DMA | 35.02 | | 20 day DMA | 34.62 | | 35 day DMA | 33.42 | | 50 day DMA | 33.4 | | 100 day DMA | 33 | | 150 day DMA | 34.93 | | 200 day DMA | 35.29 | EMA (exponential moving average) of Antero Resources AR
| EMA period | EMA current | EMA prev | EMA prev2 | | 5 day EMA | 35.9 | 35.55 | 35.12 | | 12 day EMA | 35.19 | 34.94 | 34.68 | | 20 day EMA | 34.65 | 34.45 | 34.24 | | 35 day EMA | 34.14 | 34 | 33.86 | | 50 day EMA | 33.6 | 33.48 | 33.36 |
SMA (simple moving average) of Antero Resources AR
| SMA period | SMA current | SMA prev | SMA prev2 | | 5 day SMA | 35.98 | 35.69 | 35.21 | | 12 day SMA | 35.02 | 34.78 | 34.61 | | 20 day SMA | 34.62 | 34.43 | 34.26 | | 35 day SMA | 33.42 | 33.29 | 33.16 | | 50 day SMA | 33.4 | 33.35 | 33.29 | | 100 day SMA | 33 | 33 | 33.01 | | 150 day SMA | 34.93 | 34.92 | 34.92 | | 200 day SMA | 35.29 | 35.31 | 35.33 |
|
|
