AsiaPacific APWC full analysis,charts,indicators,moving averages,SMA,DMA,EMA,ADX,MACD,RSIAsia Pacific APWC WideScreen charts, DMA,SMA,EMA technical analysis, forecast prediction, by indicators ADX,MACD,RSI,CCI USA stock exchange
operates under Basic Industries sector & deals in Telecommunications Equipment
Daily price and charts and targets AsiaPacific Strong Daily Stock price targets for AsiaPacific APWC are 1.82 and 1.92 | Daily Target 1 | 1.8 | | Daily Target 2 | 1.84 | | Daily Target 3 | 1.9033333333333 | | Daily Target 4 | 1.94 | | Daily Target 5 | 2 |
Daily price and volume Asia Pacific
| Date |
Closing |
Open |
Range |
Volume |
Mon 20 October 2025 |
1.87 (-4.1%) |
1.97 |
1.87 - 1.97 |
0.9338 times |
Fri 17 October 2025 |
1.95 (2.09%) |
1.97 |
1.91 - 2.02 |
0.456 times |
Thu 16 October 2025 |
1.91 (-1.04%) |
1.90 |
1.90 - 1.94 |
0.2823 times |
Wed 15 October 2025 |
1.93 (1.05%) |
1.90 |
1.90 - 1.99 |
1.3246 times |
Tue 14 October 2025 |
1.91 (-3.05%) |
1.97 |
1.89 - 2.03 |
0.8686 times |
Mon 13 October 2025 |
1.97 (0.51%) |
1.95 |
1.95 - 2.03 |
0.4886 times |
Fri 10 October 2025 |
1.96 (0.51%) |
2.00 |
1.95 - 2.02 |
0.5755 times |
Thu 09 October 2025 |
1.95 (-0.51%) |
1.96 |
1.95 - 2.01 |
0.3257 times |
Wed 08 October 2025 |
1.96 (1.55%) |
1.98 |
1.91 - 1.98 |
1.4115 times |
Tue 07 October 2025 |
1.93 (-5.85%) |
1.97 |
1.91 - 1.99 |
3.3333 times |
Mon 06 October 2025 |
2.05 (-1.44%) |
2.12 |
2.05 - 2.14 |
1.0858 times |
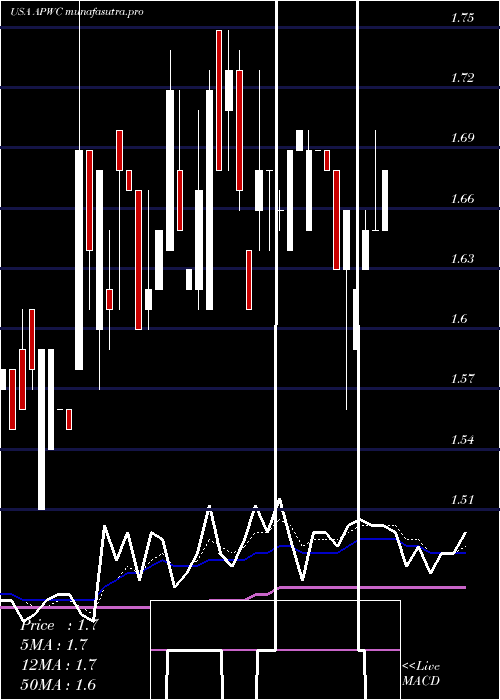
Weekly price and charts AsiaPacific Strong weekly Stock price targets for AsiaPacific APWC are 1.82 and 1.92 | Weekly Target 1 | 1.8 | | Weekly Target 2 | 1.84 | | Weekly Target 3 | 1.9033333333333 | | Weekly Target 4 | 1.94 | | Weekly Target 5 | 2 |
Weekly price and volumes for Asia Pacific
| Date |
Closing |
Open |
Range |
Volume |
Mon 20 October 2025 |
1.87 (-4.1%) |
1.97 |
1.87 - 1.97 |
0.1242 times |
Fri 17 October 2025 |
1.95 (-0.51%) |
1.95 |
1.89 - 2.03 |
0.4548 times |
Fri 10 October 2025 |
1.96 (-5.77%) |
2.12 |
1.91 - 2.14 |
0.8951 times |
Fri 03 October 2025 |
2.08 (1.96%) |
2.06 |
2.01 - 2.16 |
1.003 times |
Fri 26 September 2025 |
2.04 (-7.69%) |
2.34 |
2.02 - 2.34 |
1.9605 times |
Fri 19 September 2025 |
2.21 (6.76%) |
2.08 |
1.98 - 2.23 |
2.9538 times |
Fri 12 September 2025 |
2.07 (15%) |
1.80 |
1.71 - 2.12 |
1.6588 times |
Fri 05 September 2025 |
1.80 (-1.64%) |
1.82 |
1.75 - 1.86 |
0.693 times |
Fri 29 August 2025 |
1.83 (0%) |
1.82 |
1.79 - 1.83 |
0.0274 times |
Fri 29 August 2025 |
1.83 (2.23%) |
1.79 |
1.70 - 1.83 |
0.2295 times |
Fri 22 August 2025 |
1.79 (-0.56%) |
1.85 |
1.64 - 1.85 |
0.8056 times |
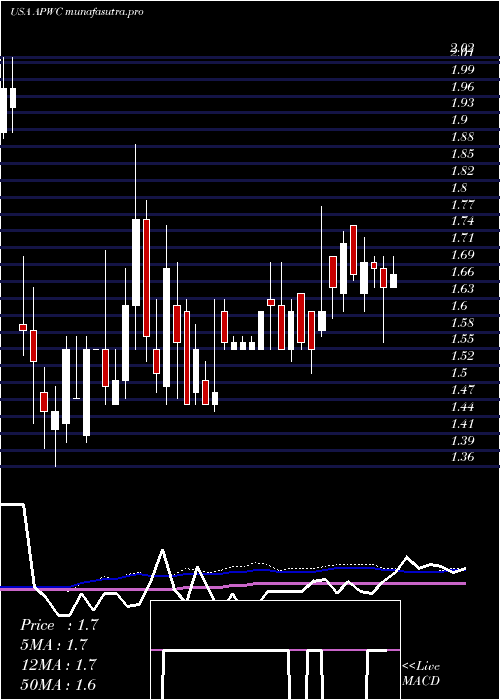
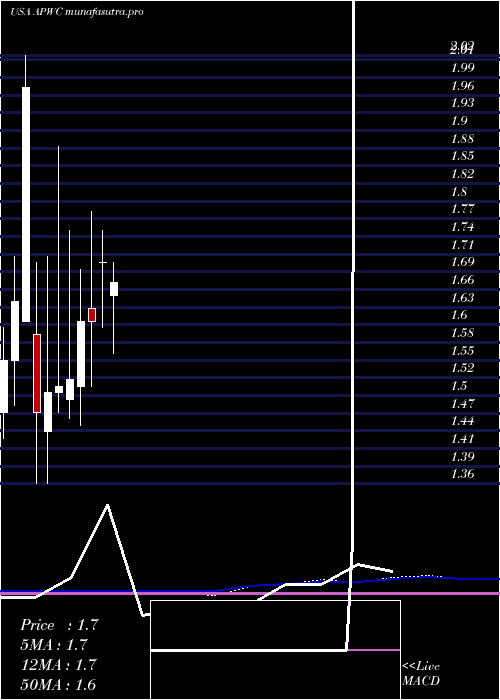
Monthly price and charts AsiaPacific Strong monthly Stock price targets for AsiaPacific APWC are 1.73 and 2.02 | Monthly Target 1 | 1.68 | | Monthly Target 2 | 1.77 | | Monthly Target 3 | 1.9666666666667 | | Monthly Target 4 | 2.06 | | Monthly Target 5 | 2.26 |
Monthly price and volumes Asia Pacific
| Date |
Closing |
Open |
Range |
Volume |
Mon 20 October 2025 |
1.87 (-9.22%) |
2.10 |
1.87 - 2.16 |
0.6888 times |
Tue 30 September 2025 |
2.06 (12.57%) |
1.82 |
1.71 - 2.34 |
2.8386 times |
Fri 29 August 2025 |
1.83 (-0.54%) |
1.89 |
1.64 - 2.00 |
1.1211 times |
Thu 31 July 2025 |
1.84 (8.24%) |
1.65 |
1.56 - 1.93 |
0.6862 times |
Mon 30 June 2025 |
1.70 (5.59%) |
1.70 |
1.60 - 1.75 |
0.9675 times |
Fri 30 May 2025 |
1.61 (0%) |
1.63 |
1.51 - 1.78 |
0.8885 times |
Wed 30 April 2025 |
1.61 (5.92%) |
1.51 |
1.45 - 1.69 |
0.645 times |
Mon 31 March 2025 |
1.52 (0.66%) |
1.49 |
1.46 - 1.75 |
0.4821 times |
Fri 28 February 2025 |
1.51 (0.67%) |
1.50 |
1.47 - 1.88 |
0.7495 times |
Fri 31 January 2025 |
1.50 (2.04%) |
1.44 |
1.36 - 1.71 |
0.9327 times |
Tue 31 December 2024 |
1.47 (-25.38%) |
1.59 |
1.36 - 1.70 |
1.139 times |
DMA SMA EMA moving averages of Asia Pacific APWC
DMA (daily moving average) of Asia Pacific APWC
| DMA period | DMA value | | 5 day DMA | 1.91 | | 12 day DMA | 1.96 | | 20 day DMA | 2.01 | | 35 day DMA | 1.99 | | 50 day DMA | 1.92 | | 100 day DMA | 1.82 | | 150 day DMA | 1.73 | | 200 day DMA | 1.68 | EMA (exponential moving average) of Asia Pacific APWC
| EMA period | EMA current | EMA prev | EMA prev2 | | 5 day EMA | 1.92 | 1.94 | 1.93 | | 12 day EMA | 1.95 | 1.97 | 1.97 | | 20 day EMA | 1.96 | 1.97 | 1.97 | | 35 day EMA | 1.96 | 1.97 | 1.97 | | 50 day EMA | 1.91 | 1.91 | 1.91 |
SMA (simple moving average) of Asia Pacific APWC
| SMA period | SMA current | SMA prev | SMA prev2 | | 5 day SMA | 1.91 | 1.93 | 1.94 | | 12 day SMA | 1.96 | 1.97 | 1.99 | | 20 day SMA | 2.01 | 2.03 | 2.05 | | 35 day SMA | 1.99 | 1.98 | 1.98 | | 50 day SMA | 1.92 | 1.92 | 1.92 | | 100 day SMA | 1.82 | 1.81 | 1.81 | | 150 day SMA | 1.73 | 1.73 | 1.73 | | 200 day SMA | 1.68 | 1.68 | 1.68 |
|
|
