AppianCorporation APPN full analysis,charts,indicators,moving averages,SMA,DMA,EMA,ADX,MACD,RSIAppian Corporation APPN WideScreen charts, DMA,SMA,EMA technical analysis, forecast prediction, by indicators ADX,MACD,RSI,CCI USA stock exchange
operates under Technology sector & deals in Computer Software Prepackaged Software
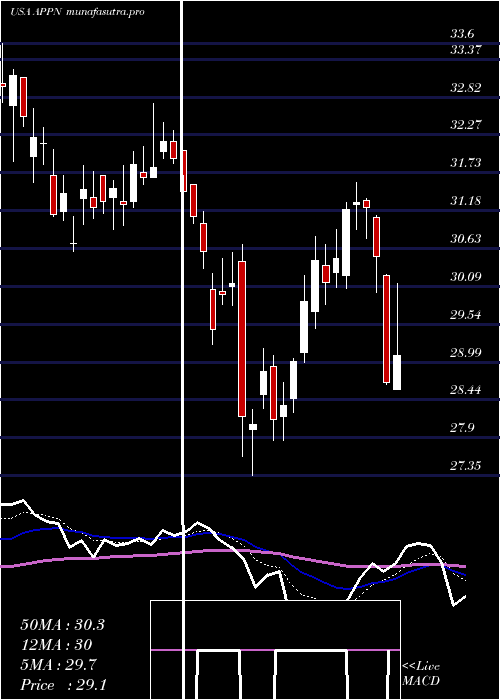
Daily price and charts and targets AppianCorporation Strong Daily Stock price targets for AppianCorporation APPN are 38.62 and 39.53 | Daily Target 1 | 38.36 | | Daily Target 2 | 38.88 | | Daily Target 3 | 39.273333333333 | | Daily Target 4 | 39.79 | | Daily Target 5 | 40.18 |
Daily price and volume Appian Corporation
| Date |
Closing |
Open |
Range |
Volume |
Thu 04 December 2025 |
39.39 (-0.03%) |
39.62 |
38.76 - 39.67 |
0.6501 times |
Wed 03 December 2025 |
39.40 (-3.74%) |
40.64 |
38.51 - 40.77 |
1.5535 times |
Tue 02 December 2025 |
40.93 (2.27%) |
40.33 |
39.91 - 41.58 |
1.2287 times |
Mon 01 December 2025 |
40.02 (-0.94%) |
39.77 |
39.70 - 40.98 |
1.1578 times |
Fri 28 November 2025 |
40.40 (-1.66%) |
41.08 |
40.18 - 41.27 |
0.4691 times |
Wed 26 November 2025 |
41.08 (-2.61%) |
42.02 |
40.80 - 42.22 |
1.0052 times |
Tue 25 November 2025 |
42.18 (2.13%) |
41.51 |
41.09 - 42.76 |
0.9998 times |
Mon 24 November 2025 |
41.30 (-0.1%) |
41.37 |
41.19 - 42.24 |
0.9697 times |
Fri 21 November 2025 |
41.34 (3.14%) |
40.12 |
39.22 - 41.46 |
1.0626 times |
Thu 20 November 2025 |
40.08 (-2.67%) |
42.03 |
40.03 - 42.18 |
0.9035 times |
Wed 19 November 2025 |
41.18 (-2.46%) |
42.11 |
41.02 - 42.32 |
1.1512 times |
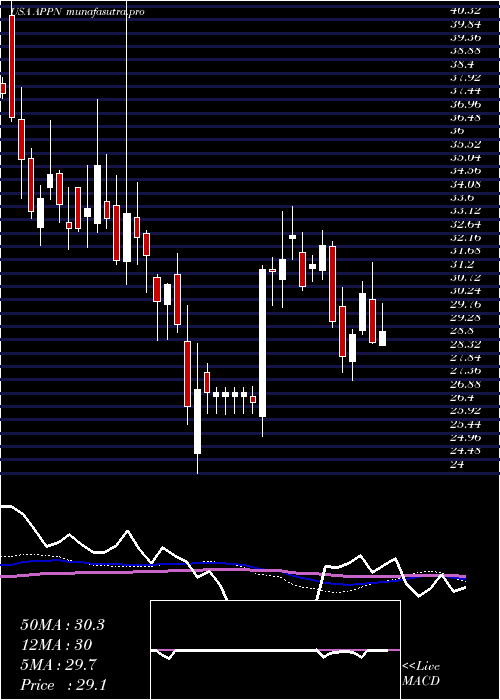
Weekly price and charts AppianCorporation Strong weekly Stock price targets for AppianCorporation APPN are 37.42 and 40.49 | Weekly Target 1 | 36.76 | | Weekly Target 2 | 38.07 | | Weekly Target 3 | 39.826666666667 | | Weekly Target 4 | 41.14 | | Weekly Target 5 | 42.9 |
Weekly price and volumes for Appian Corporation
| Date |
Closing |
Open |
Range |
Volume |
Thu 04 December 2025 |
39.39 (-2.5%) |
39.77 |
38.51 - 41.58 |
0.8537 times |
Fri 28 November 2025 |
40.40 (-2.27%) |
41.37 |
40.18 - 42.76 |
0.6405 times |
Fri 21 November 2025 |
41.34 (-4.46%) |
43.13 |
39.22 - 43.24 |
1.004 times |
Fri 14 November 2025 |
43.27 (7.4%) |
40.80 |
40.21 - 46.06 |
1.6864 times |
Fri 07 November 2025 |
40.29 (34.61%) |
30.00 |
28.56 - 40.70 |
1.8963 times |
Fri 31 October 2025 |
29.93 (0%) |
29.75 |
29.48 - 30.09 |
0.1533 times |
Fri 31 October 2025 |
29.93 (-5.34%) |
32.01 |
29.38 - 32.08 |
0.6523 times |
Fri 24 October 2025 |
31.62 (12.33%) |
28.34 |
28.24 - 32.27 |
1.1335 times |
Fri 17 October 2025 |
28.15 (-1.26%) |
28.78 |
27.07 - 28.99 |
1.191 times |
Fri 10 October 2025 |
28.51 (-5.03%) |
30.10 |
28.28 - 30.95 |
0.789 times |
Fri 03 October 2025 |
30.02 (-3.1%) |
31.15 |
29.44 - 31.25 |
0.8042 times |
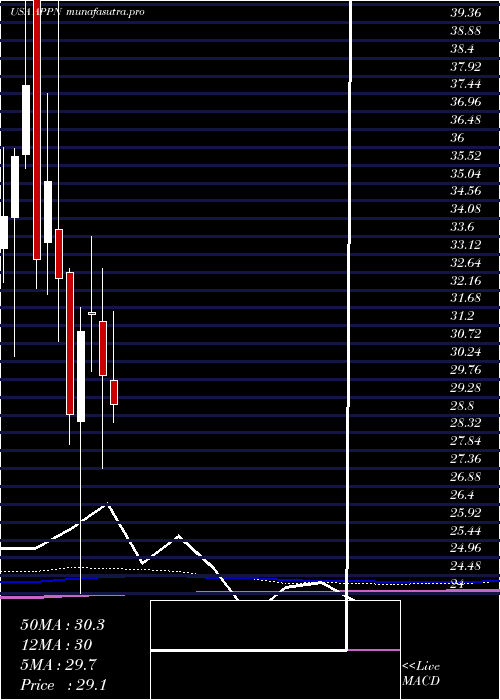
Monthly price and charts AppianCorporation Strong monthly Stock price targets for AppianCorporation APPN are 37.42 and 40.49 | Monthly Target 1 | 36.76 | | Monthly Target 2 | 38.07 | | Monthly Target 3 | 39.826666666667 | | Monthly Target 4 | 41.14 | | Monthly Target 5 | 42.9 |
Monthly price and volumes Appian Corporation
| Date |
Closing |
Open |
Range |
Volume |
Thu 04 December 2025 |
39.39 (-2.5%) |
39.77 |
38.51 - 41.58 |
0.1965 times |
Fri 28 November 2025 |
40.40 (34.98%) |
30.00 |
28.56 - 46.06 |
1.2029 times |
Fri 31 October 2025 |
29.93 (-2.09%) |
30.32 |
27.07 - 32.27 |
1.0008 times |
Tue 30 September 2025 |
30.57 (-0.68%) |
30.54 |
29.40 - 34.07 |
1.3036 times |
Fri 29 August 2025 |
30.78 (11.48%) |
27.40 |
26.68 - 32.42 |
1.7665 times |
Thu 31 July 2025 |
27.61 (-7.54%) |
29.72 |
27.48 - 31.58 |
1.1477 times |
Mon 30 June 2025 |
29.86 (-5.21%) |
31.31 |
27.35 - 32.73 |
0.7857 times |
Fri 30 May 2025 |
31.50 (1.45%) |
31.56 |
29.97 - 33.60 |
0.9157 times |
Wed 30 April 2025 |
31.05 (7.78%) |
28.63 |
24.00 - 31.68 |
0.862 times |
Mon 31 March 2025 |
28.81 (-11.27%) |
32.64 |
28.02 - 32.73 |
0.8187 times |
Fri 28 February 2025 |
32.47 (-7.47%) |
33.78 |
30.79 - 41.05 |
0.7496 times |
DMA SMA EMA moving averages of Appian Corporation APPN
DMA (daily moving average) of Appian Corporation APPN
| DMA period | DMA value | | 5 day DMA | 40.03 | | 12 day DMA | 40.79 | | 20 day DMA | 41.41 | | 35 day DMA | 36.45 | | 50 day DMA | 34.46 | | 100 day DMA | 32.23 | | 150 day DMA | 31.78 | | 200 day DMA | 31.25 | EMA (exponential moving average) of Appian Corporation APPN
| EMA period | EMA current | EMA prev | EMA prev2 | | 5 day EMA | 40.02 | 40.33 | 40.8 | | 12 day EMA | 40.26 | 40.42 | 40.61 | | 20 day EMA | 39.47 | 39.48 | 39.49 | | 35 day EMA | 37.68 | 37.58 | 37.47 | | 50 day EMA | 34.89 | 34.71 | 34.52 |
SMA (simple moving average) of Appian Corporation APPN
| SMA period | SMA current | SMA prev | SMA prev2 | | 5 day SMA | 40.03 | 40.37 | 40.92 | | 12 day SMA | 40.79 | 40.97 | 41.3 | | 20 day SMA | 41.41 | 40.91 | 40.38 | | 35 day SMA | 36.45 | 36.12 | 35.8 | | 50 day SMA | 34.46 | 34.32 | 34.2 | | 100 day SMA | 32.23 | 32.13 | 32.02 | | 150 day SMA | 31.78 | 31.72 | 31.67 | | 200 day SMA | 31.25 | 31.22 | 31.18 |
|
|
