ApolloGlobal APO full analysis,charts,indicators,moving averages,SMA,DMA,EMA,ADX,MACD,RSIApollo Global APO WideScreen charts, DMA,SMA,EMA technical analysis, forecast prediction, by indicators ADX,MACD,RSI,CCI USA stock exchange
operates under Finance sector & deals in Investment Managers
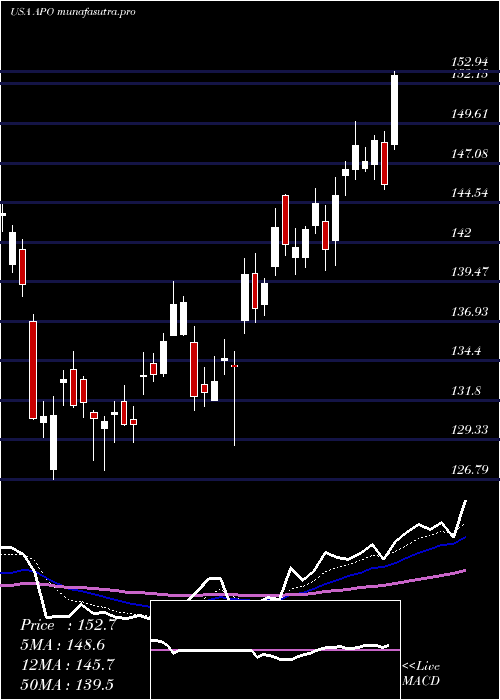
Daily price and charts and targets ApolloGlobal Strong Daily Stock price targets for ApolloGlobal APO are 135.39 and 138.21 | Daily Target 1 | 133.06 | | Daily Target 2 | 134.9 | | Daily Target 3 | 135.87666666667 | | Daily Target 4 | 137.72 | | Daily Target 5 | 138.7 |
Daily price and volume Apollo Global
| Date |
Closing |
Open |
Range |
Volume |
Thu 04 December 2025 |
136.75 (1.67%) |
135.25 |
134.03 - 136.85 |
0.8909 times |
Wed 03 December 2025 |
134.50 (1.83%) |
132.02 |
131.08 - 135.56 |
1.6067 times |
Tue 02 December 2025 |
132.08 (0.53%) |
131.56 |
131.01 - 133.47 |
0.528 times |
Mon 01 December 2025 |
131.39 (-0.35%) |
130.19 |
129.04 - 132.32 |
0.916 times |
Fri 28 November 2025 |
131.85 (1.21%) |
131.69 |
130.30 - 133.15 |
0.4628 times |
Wed 26 November 2025 |
130.27 (-0.27%) |
131.00 |
130.27 - 132.32 |
0.8769 times |
Tue 25 November 2025 |
130.62 (0.4%) |
130.20 |
127.37 - 131.08 |
1.1428 times |
Mon 24 November 2025 |
130.10 (0.06%) |
129.90 |
128.99 - 131.00 |
1.1891 times |
Fri 21 November 2025 |
130.02 (2.57%) |
127.76 |
125.95 - 130.76 |
1.0685 times |
Thu 20 November 2025 |
126.76 (-0.35%) |
131.82 |
126.69 - 132.68 |
1.3183 times |
Wed 19 November 2025 |
127.20 (2.32%) |
124.65 |
124.19 - 127.47 |
0.9374 times |
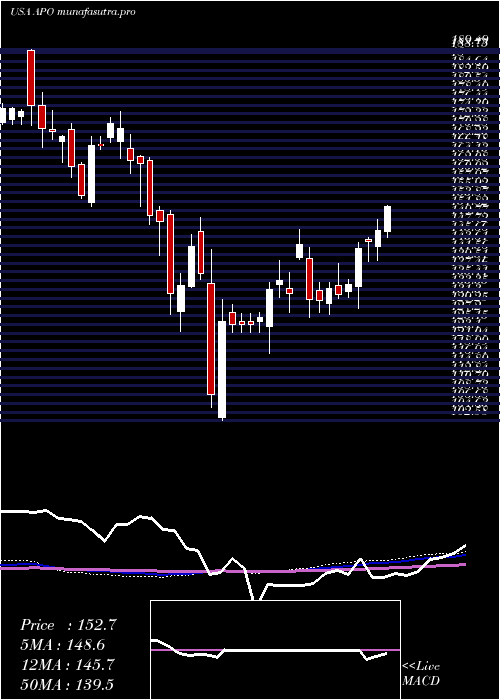
Weekly price and charts ApolloGlobal Strong weekly Stock price targets for ApolloGlobal APO are 132.9 and 140.71 | Weekly Target 1 | 126.4 | | Weekly Target 2 | 131.58 | | Weekly Target 3 | 134.21333333333 | | Weekly Target 4 | 139.39 | | Weekly Target 5 | 142.02 |
Weekly price and volumes for Apollo Global
| Date |
Closing |
Open |
Range |
Volume |
Thu 04 December 2025 |
136.75 (3.72%) |
130.19 |
129.04 - 136.85 |
0.8195 times |
Fri 28 November 2025 |
131.85 (1.41%) |
129.90 |
127.37 - 133.15 |
0.7633 times |
Fri 21 November 2025 |
130.02 (-0.44%) |
130.00 |
122.49 - 132.68 |
1.1728 times |
Fri 14 November 2025 |
130.60 (-1.36%) |
135.07 |
125.59 - 137.03 |
1.1274 times |
Fri 07 November 2025 |
132.40 (6.51%) |
126.54 |
124.10 - 136.91 |
1.0862 times |
Fri 31 October 2025 |
124.31 (0%) |
122.50 |
121.93 - 124.84 |
0.2112 times |
Fri 31 October 2025 |
124.31 (-0.55%) |
126.89 |
121.93 - 127.97 |
0.9667 times |
Fri 24 October 2025 |
125.00 (2.98%) |
122.52 |
122.00 - 127.91 |
0.9453 times |
Fri 17 October 2025 |
121.38 (2.67%) |
120.50 |
119.00 - 129.98 |
1.4794 times |
Fri 10 October 2025 |
118.22 (-6.69%) |
126.00 |
118.14 - 127.66 |
1.4282 times |
Fri 03 October 2025 |
126.70 (-7.94%) |
138.70 |
125.18 - 139.37 |
1.1663 times |
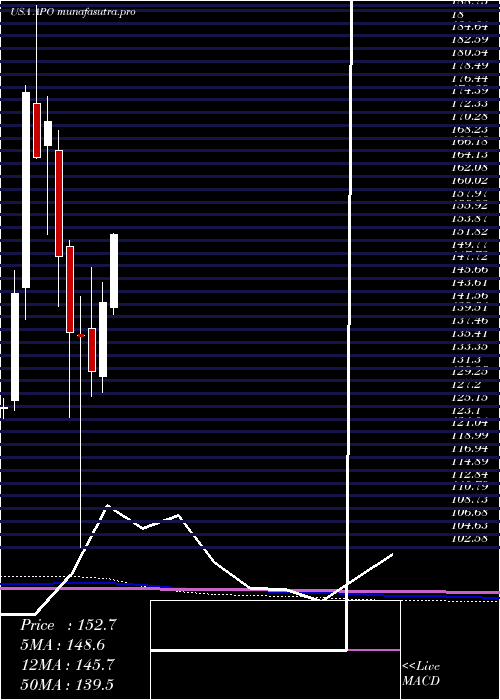
Monthly price and charts ApolloGlobal Strong monthly Stock price targets for ApolloGlobal APO are 132.9 and 140.71 | Monthly Target 1 | 126.4 | | Monthly Target 2 | 131.58 | | Monthly Target 3 | 134.21333333333 | | Monthly Target 4 | 139.39 | | Monthly Target 5 | 142.02 |
Monthly price and volumes Apollo Global
| Date |
Closing |
Open |
Range |
Volume |
Thu 04 December 2025 |
136.75 (3.72%) |
130.19 |
129.04 - 136.85 |
0.1751 times |
Fri 28 November 2025 |
131.85 (6.07%) |
126.54 |
122.49 - 137.03 |
0.8869 times |
Fri 31 October 2025 |
124.31 (-6.72%) |
131.40 |
118.14 - 133.80 |
1.2161 times |
Tue 30 September 2025 |
133.27 (-2.17%) |
134.35 |
128.98 - 148.21 |
1.0715 times |
Fri 29 August 2025 |
136.23 (-6.26%) |
142.01 |
132.22 - 151.58 |
1.0969 times |
Thu 31 July 2025 |
145.32 (2.43%) |
141.02 |
139.93 - 157.08 |
0.7833 times |
Mon 30 June 2025 |
141.87 (8.55%) |
130.04 |
127.37 - 145.03 |
0.839 times |
Fri 30 May 2025 |
130.69 (-4.24%) |
137.64 |
126.79 - 147.44 |
1.0853 times |
Wed 30 April 2025 |
136.48 (-0.34%) |
136.61 |
102.58 - 142.78 |
1.6526 times |
Mon 31 March 2025 |
136.94 (-8.26%) |
150.89 |
123.39 - 151.80 |
1.1932 times |
Fri 28 February 2025 |
149.27 (-12.7%) |
166.28 |
141.20 - 169.50 |
0.9715 times |
DMA SMA EMA moving averages of Apollo Global APO
DMA (daily moving average) of Apollo Global APO
| DMA period | DMA value | | 5 day DMA | 133.31 | | 12 day DMA | 130.49 | | 20 day DMA | 130.41 | | 35 day DMA | 128.24 | | 50 day DMA | 128.3 | | 100 day DMA | 134.73 | | 150 day DMA | 135.64 | | 200 day DMA | 135.43 | EMA (exponential moving average) of Apollo Global APO
| EMA period | EMA current | EMA prev | EMA prev2 | | 5 day EMA | 133.77 | 132.28 | 131.17 | | 12 day EMA | 131.72 | 130.8 | 130.13 | | 20 day EMA | 130.71 | 130.08 | 129.62 | | 35 day EMA | 130.29 | 129.91 | 129.64 | | 50 day EMA | 130 | 129.72 | 129.53 |
SMA (simple moving average) of Apollo Global APO
| SMA period | SMA current | SMA prev | SMA prev2 | | 5 day SMA | 133.31 | 132.02 | 131.24 | | 12 day SMA | 130.49 | 129.45 | 129.13 | | 20 day SMA | 130.41 | 130.26 | 130.07 | | 35 day SMA | 128.24 | 127.98 | 127.78 | | 50 day SMA | 128.3 | 128.3 | 128.51 | | 100 day SMA | 134.73 | 134.81 | 134.96 | | 150 day SMA | 135.64 | 135.64 | 135.66 | | 200 day SMA | 135.43 | 135.56 | 135.7 |
|
|
