AptorumGroup APM full analysis,charts,indicators,moving averages,SMA,DMA,EMA,ADX,MACD,RSIAptorum Group APM WideScreen charts, DMA,SMA,EMA technical analysis, forecast prediction, by indicators ADX,MACD,RSI,CCI USA stock exchange
operates under Health Care sector & deals in Major Pharmaceuticals
Daily price and charts and targets AptorumGroup Strong Daily Stock price targets for AptorumGroup APM are 1.56 and 1.72 | Daily Target 1 | 1.43 | | Daily Target 2 | 1.52 | | Daily Target 3 | 1.5933333333333 | | Daily Target 4 | 1.68 | | Daily Target 5 | 1.75 |
Daily price and volume Aptorum Group
| Date |
Closing |
Open |
Range |
Volume |
Mon 20 October 2025 |
1.60 (3.23%) |
1.51 |
1.51 - 1.67 |
0.2668 times |
Fri 17 October 2025 |
1.55 (-1.27%) |
1.50 |
1.47 - 1.59 |
0.2552 times |
Thu 16 October 2025 |
1.57 (0%) |
1.57 |
1.52 - 1.59 |
0.2782 times |
Wed 15 October 2025 |
1.57 (-1.26%) |
1.59 |
1.53 - 1.63 |
0.3505 times |
Tue 14 October 2025 |
1.59 (0.63%) |
1.56 |
1.50 - 1.60 |
0.4997 times |
Mon 13 October 2025 |
1.58 (-4.82%) |
1.76 |
1.40 - 1.76 |
1.072 times |
Fri 10 October 2025 |
1.66 (-29.96%) |
2.40 |
1.60 - 2.40 |
4.4756 times |
Thu 09 October 2025 |
2.37 (-1.66%) |
2.45 |
2.33 - 2.45 |
0.4406 times |
Wed 08 October 2025 |
2.41 (15.31%) |
2.08 |
2.08 - 2.59 |
1.6782 times |
Tue 07 October 2025 |
2.09 (-12.55%) |
2.18 |
1.86 - 2.22 |
0.6833 times |
Mon 06 October 2025 |
2.39 (6.22%) |
2.25 |
2.21 - 2.45 |
0.504 times |
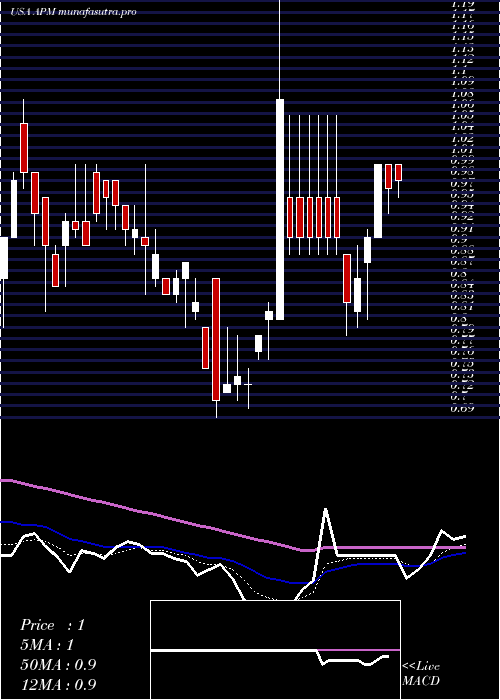
Weekly price and charts AptorumGroup Strong weekly Stock price targets for AptorumGroup APM are 1.56 and 1.72 | Weekly Target 1 | 1.43 | | Weekly Target 2 | 1.52 | | Weekly Target 3 | 1.5933333333333 | | Weekly Target 4 | 1.68 | | Weekly Target 5 | 1.75 |
Weekly price and volumes for Aptorum Group
| Date |
Closing |
Open |
Range |
Volume |
Mon 20 October 2025 |
1.60 (3.23%) |
1.51 |
1.51 - 1.67 |
0.0512 times |
Fri 17 October 2025 |
1.55 (-6.63%) |
1.76 |
1.40 - 1.76 |
0.4713 times |
Fri 10 October 2025 |
1.66 (-26.22%) |
2.25 |
1.60 - 2.59 |
1.4936 times |
Fri 03 October 2025 |
2.25 (21.62%) |
1.77 |
1.77 - 2.50 |
1.6719 times |
Fri 26 September 2025 |
1.85 (3.93%) |
1.75 |
1.71 - 1.85 |
0.1675 times |
Fri 19 September 2025 |
1.78 (-10.1%) |
1.98 |
1.75 - 2.02 |
0.3483 times |
Fri 12 September 2025 |
1.98 (7.03%) |
1.80 |
1.68 - 1.98 |
2.0498 times |
Fri 05 September 2025 |
1.85 (-6.09%) |
1.90 |
1.64 - 1.97 |
0.5567 times |
Fri 29 August 2025 |
1.97 (0%) |
2.23 |
1.93 - 2.25 |
0.2408 times |
Fri 29 August 2025 |
1.97 (-25.38%) |
2.42 |
1.93 - 2.65 |
2.9489 times |
Fri 22 August 2025 |
2.64 (89.93%) |
1.37 |
1.26 - 4.47 |
195.9865 times |
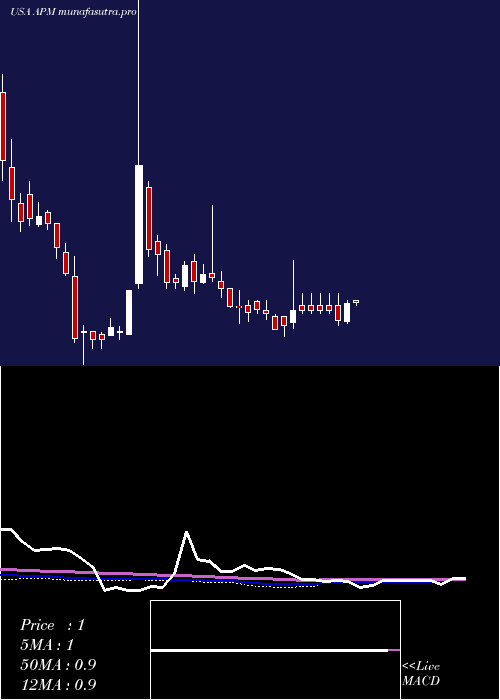
Monthly price and charts AptorumGroup Strong monthly Stock price targets for AptorumGroup APM are 0.91 and 2.1 | Monthly Target 1 | 0.67 | | Monthly Target 2 | 1.14 | | Monthly Target 3 | 1.8633333333333 | | Monthly Target 4 | 2.33 | | Monthly Target 5 | 3.05 |
Monthly price and volumes Aptorum Group
| Date |
Closing |
Open |
Range |
Volume |
Mon 20 October 2025 |
1.60 (-20.79%) |
2.24 |
1.40 - 2.59 |
0.0886 times |
Tue 30 September 2025 |
2.02 (2.54%) |
1.90 |
1.64 - 2.39 |
0.1257 times |
Fri 29 August 2025 |
1.97 (27.1%) |
1.54 |
1.21 - 4.47 |
6.2825 times |
Thu 31 July 2025 |
1.55 (70.33%) |
0.93 |
0.86 - 4.42 |
3.0683 times |
Mon 30 June 2025 |
0.91 (-1.09%) |
0.97 |
0.90 - 1.35 |
0.0274 times |
Fri 30 May 2025 |
0.92 (-2.13%) |
0.91 |
0.77 - 1.08 |
0.0089 times |
Wed 30 April 2025 |
0.94 (11.9%) |
0.84 |
0.69 - 1.34 |
0.0409 times |
Mon 31 March 2025 |
0.84 (-11.58%) |
0.95 |
0.80 - 1.08 |
0.0082 times |
Fri 28 February 2025 |
0.95 (-18.1%) |
1.15 |
0.94 - 1.80 |
0.0393 times |
Fri 31 January 2025 |
1.16 (-58.57%) |
3.20 |
1.06 - 4.80 |
0.3101 times |
Tue 31 December 2024 |
2.80 (317.91%) |
0.70 |
0.67 - 7.49 |
1.7582 times |

DMA SMA EMA moving averages of Aptorum Group APM
DMA (daily moving average) of Aptorum Group APM
| DMA period | DMA value | | 5 day DMA | 1.58 | | 12 day DMA | 1.89 | | 20 day DMA | 1.9 | | 35 day DMA | 1.87 | | 50 day DMA | 1.9 | | 100 day DMA | 1.56 | | 150 day DMA | 1.34 | | 200 day DMA | 1.29 | EMA (exponential moving average) of Aptorum Group APM
| EMA period | EMA current | EMA prev | EMA prev2 | | 5 day EMA | 1.62 | 1.63 | 1.67 | | 12 day EMA | 1.75 | 1.78 | 1.82 | | 20 day EMA | 1.81 | 1.83 | 1.86 | | 35 day EMA | 1.85 | 1.86 | 1.88 | | 50 day EMA | 1.83 | 1.84 | 1.85 |
SMA (simple moving average) of Aptorum Group APM
| SMA period | SMA current | SMA prev | SMA prev2 | | 5 day SMA | 1.58 | 1.57 | 1.59 | | 12 day SMA | 1.89 | 1.94 | 1.99 | | 20 day SMA | 1.9 | 1.91 | 1.92 | | 35 day SMA | 1.87 | 1.88 | 1.89 | | 50 day SMA | 1.9 | 1.9 | 1.89 | | 100 day SMA | 1.56 | 1.55 | 1.55 | | 150 day SMA | 1.34 | 1.33 | 1.33 | | 200 day SMA | 1.29 | 1.29 | 1.3 |
|
|
