AirProducts APD full analysis,charts,indicators,moving averages,SMA,DMA,EMA,ADX,MACD,RSIAir Products APD WideScreen charts, DMA,SMA,EMA technical analysis, forecast prediction, by indicators ADX,MACD,RSI,CCI USA stock exchange
operates under Basic Industries sector & deals in Major Chemicals
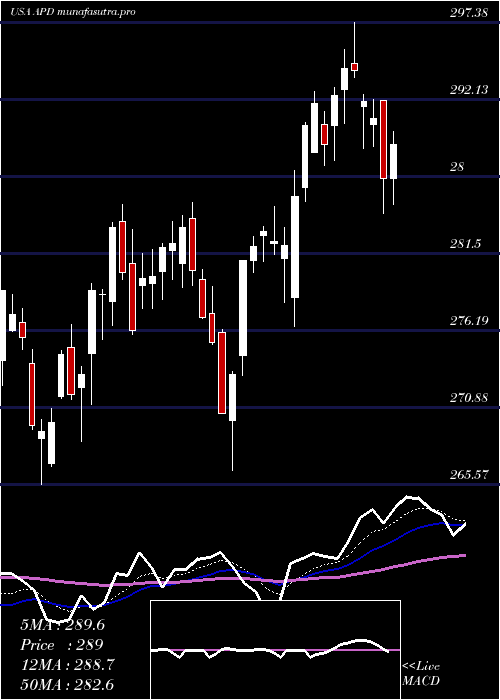
Daily price and charts and targets AirProducts Strong Daily Stock price targets for AirProducts APD are 257.92 and 263.11 | Daily Target 1 | 256.99 | | Daily Target 2 | 258.84 | | Daily Target 3 | 262.18 | | Daily Target 4 | 264.03 | | Daily Target 5 | 267.37 |
Daily price and volume Air Products
| Date |
Closing |
Open |
Range |
Volume |
Fri 05 December 2025 |
260.69 (-0.36%) |
261.52 |
260.33 - 265.52 |
1.0699 times |
Thu 04 December 2025 |
261.62 (0.49%) |
260.37 |
258.00 - 262.54 |
1.1013 times |
Wed 03 December 2025 |
260.35 (1.39%) |
257.82 |
257.66 - 261.55 |
1.1918 times |
Tue 02 December 2025 |
256.77 (-1.57%) |
260.84 |
256.23 - 261.10 |
0.8495 times |
Mon 01 December 2025 |
260.86 (-0.07%) |
260.00 |
259.50 - 263.07 |
1.0449 times |
Fri 28 November 2025 |
261.05 (0.81%) |
260.16 |
258.97 - 262.29 |
0.3719 times |
Wed 26 November 2025 |
258.96 (0.01%) |
258.30 |
257.57 - 260.83 |
0.5901 times |
Tue 25 November 2025 |
258.93 (0.92%) |
258.48 |
257.00 - 259.88 |
1.0036 times |
Mon 24 November 2025 |
256.58 (-0.31%) |
256.38 |
252.71 - 257.32 |
1.3286 times |
Fri 21 November 2025 |
257.37 (2.5%) |
252.22 |
251.38 - 257.77 |
1.4484 times |
Thu 20 November 2025 |
251.09 (-0.85%) |
254.07 |
250.89 - 258.56 |
0.9404 times |
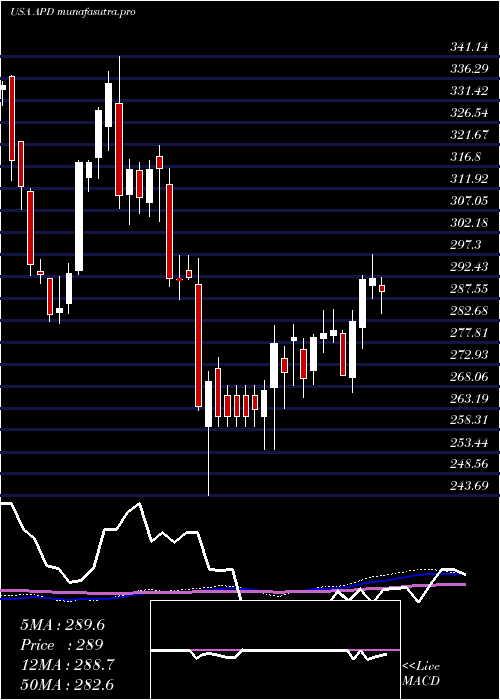
Weekly price and charts AirProducts Strong weekly Stock price targets for AirProducts APD are 258.46 and 267.75 | Weekly Target 1 | 251.52 | | Weekly Target 2 | 256.11 | | Weekly Target 3 | 260.81333333333 | | Weekly Target 4 | 265.4 | | Weekly Target 5 | 270.1 |
Weekly price and volumes for Air Products
| Date |
Closing |
Open |
Range |
Volume |
Fri 05 December 2025 |
260.69 (-0.14%) |
260.00 |
256.23 - 265.52 |
1.1618 times |
Fri 28 November 2025 |
261.05 (1.43%) |
256.38 |
252.71 - 262.29 |
0.7279 times |
Fri 21 November 2025 |
257.37 (-0.76%) |
258.28 |
249.20 - 258.64 |
1.0983 times |
Fri 14 November 2025 |
259.34 (-0.15%) |
260.55 |
256.46 - 265.79 |
0.885 times |
Fri 07 November 2025 |
259.74 (7.07%) |
238.51 |
235.55 - 264.31 |
1.7616 times |
Fri 31 October 2025 |
242.59 (0%) |
244.02 |
239.03 - 244.02 |
0.3885 times |
Fri 31 October 2025 |
242.59 (-4.83%) |
255.75 |
239.03 - 257.45 |
1.1334 times |
Fri 24 October 2025 |
254.91 (0.68%) |
254.23 |
251.73 - 256.90 |
0.8828 times |
Fri 17 October 2025 |
253.20 (-1.51%) |
259.43 |
251.16 - 266.10 |
1.223 times |
Fri 10 October 2025 |
257.08 (-5.3%) |
271.35 |
256.96 - 273.61 |
0.7377 times |
Fri 03 October 2025 |
271.47 (1.76%) |
267.76 |
265.91 - 274.83 |
1.139 times |
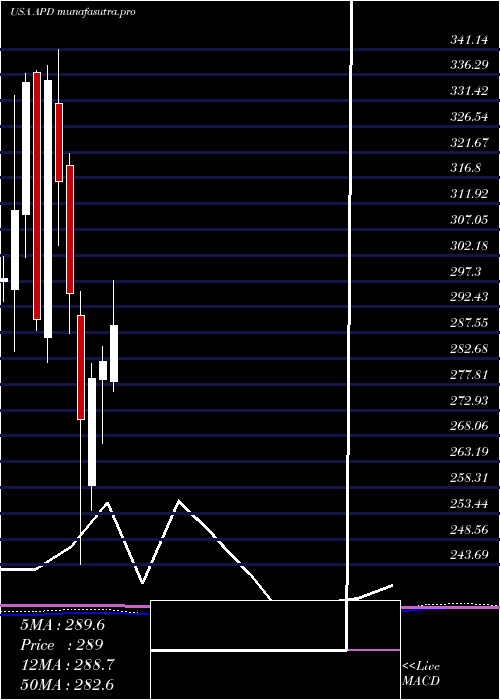
Monthly price and charts AirProducts Strong monthly Stock price targets for AirProducts APD are 258.46 and 267.75 | Monthly Target 1 | 251.52 | | Monthly Target 2 | 256.11 | | Monthly Target 3 | 260.81333333333 | | Monthly Target 4 | 265.4 | | Monthly Target 5 | 270.1 |
Monthly price and volumes Air Products
| Date |
Closing |
Open |
Range |
Volume |
Fri 05 December 2025 |
260.69 (-0.14%) |
260.00 |
256.23 - 265.52 |
0.291 times |
Fri 28 November 2025 |
261.05 (7.61%) |
238.51 |
235.55 - 265.79 |
1.1205 times |
Fri 31 October 2025 |
242.59 (-11.05%) |
269.46 |
239.03 - 274.83 |
1.2184 times |
Tue 30 September 2025 |
272.72 (-7.27%) |
292.13 |
265.10 - 298.31 |
0.9796 times |
Fri 29 August 2025 |
294.11 (2.16%) |
285.17 |
278.41 - 301.11 |
0.7468 times |
Thu 31 July 2025 |
287.88 (2.06%) |
278.44 |
276.49 - 300.52 |
0.9815 times |
Mon 30 June 2025 |
282.06 (1.13%) |
278.64 |
266.54 - 285.03 |
1.1226 times |
Fri 30 May 2025 |
278.91 (2.88%) |
258.62 |
254.01 - 281.76 |
1.1846 times |
Wed 30 April 2025 |
271.09 (-8.08%) |
290.86 |
243.69 - 295.37 |
1.249 times |
Mon 31 March 2025 |
294.92 (-6.72%) |
319.07 |
287.35 - 321.47 |
1.1059 times |
Fri 28 February 2025 |
316.15 (-5.7%) |
330.88 |
303.92 - 341.14 |
1.317 times |
DMA SMA EMA moving averages of Air Products APD
DMA (daily moving average) of Air Products APD
| DMA period | DMA value | | 5 day DMA | 260.06 | | 12 day DMA | 258.13 | | 20 day DMA | 258.36 | | 35 day DMA | 254.79 | | 50 day DMA | 258.04 | | 100 day DMA | 274.3 | | 150 day DMA | 275.97 | | 200 day DMA | 278.24 | EMA (exponential moving average) of Air Products APD
| EMA period | EMA current | EMA prev | EMA prev2 | | 5 day EMA | 260.2 | 259.95 | 259.12 | | 12 day EMA | 258.81 | 258.47 | 257.9 | | 20 day EMA | 257.99 | 257.71 | 257.3 | | 35 day EMA | 259.25 | 259.17 | 259.03 | | 50 day EMA | 259.92 | 259.89 | 259.82 |
SMA (simple moving average) of Air Products APD
| SMA period | SMA current | SMA prev | SMA prev2 | | 5 day SMA | 260.06 | 260.13 | 259.6 | | 12 day SMA | 258.13 | 257.42 | 256.71 | | 20 day SMA | 258.36 | 258.26 | 257.06 | | 35 day SMA | 254.79 | 254.58 | 254.46 | | 50 day SMA | 258.04 | 258.15 | 258.36 | | 100 day SMA | 274.3 | 274.58 | 274.84 | | 150 day SMA | 275.97 | 276.05 | 276.11 | | 200 day SMA | 278.24 | 278.5 | 278.78 |
|
|
