AonPlc AON full analysis,charts,indicators,moving averages,SMA,DMA,EMA,ADX,MACD,RSIAon Plc AON WideScreen charts, DMA,SMA,EMA technical analysis, forecast prediction, by indicators ADX,MACD,RSI,CCI USA stock exchange
operates under Finance sector & deals in Specialty Insurers
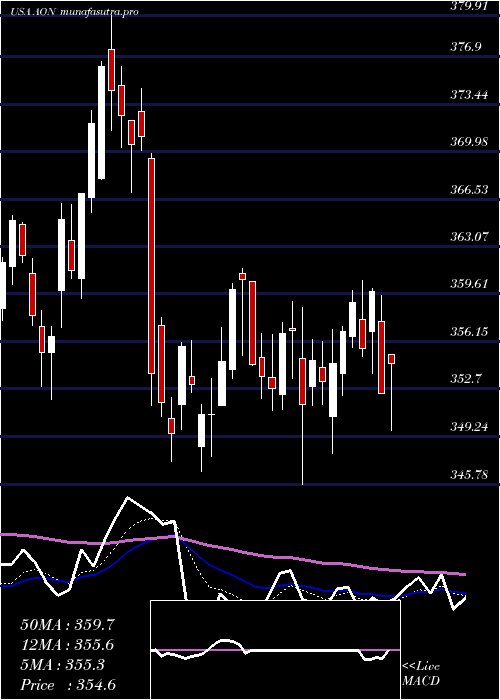
Daily price and charts and targets AonPlc Strong Daily Stock price targets for AonPlc AON are 346.08 and 349.62 | Daily Target 1 | 343.18 | | Daily Target 2 | 345.44 | | Daily Target 3 | 346.71666666667 | | Daily Target 4 | 348.98 | | Daily Target 5 | 350.26 |
Daily price and volume Aon Plc
| Date |
Closing |
Open |
Range |
Volume |
Thu 04 December 2025 |
347.71 (0.95%) |
344.45 |
344.45 - 347.99 |
0.7694 times |
Wed 03 December 2025 |
344.45 (-0.36%) |
345.49 |
341.98 - 347.34 |
0.8892 times |
Tue 02 December 2025 |
345.70 (-1.56%) |
351.04 |
345.54 - 351.66 |
1.0948 times |
Mon 01 December 2025 |
351.17 (-0.78%) |
352.69 |
350.42 - 355.48 |
1.2092 times |
Fri 28 November 2025 |
353.92 (0.37%) |
352.12 |
351.49 - 355.62 |
0.4455 times |
Wed 26 November 2025 |
352.61 (0.47%) |
351.49 |
349.77 - 353.45 |
0.7292 times |
Tue 25 November 2025 |
350.96 (1.88%) |
344.06 |
342.80 - 351.50 |
0.7713 times |
Mon 24 November 2025 |
344.50 (-0.58%) |
347.23 |
343.32 - 347.32 |
0.6477 times |
Fri 21 November 2025 |
346.51 (0.18%) |
346.00 |
344.15 - 349.70 |
2.1919 times |
Thu 20 November 2025 |
345.89 (0.5%) |
343.75 |
343.18 - 346.06 |
1.2519 times |
Wed 19 November 2025 |
344.17 (-1.25%) |
348.36 |
339.17 - 349.98 |
1.2386 times |
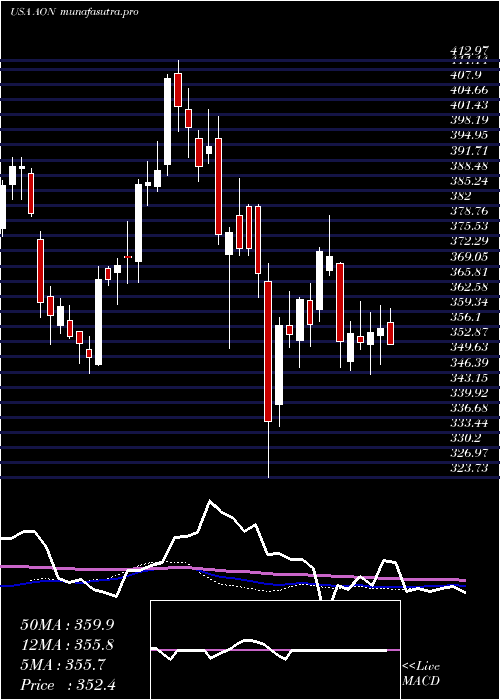
Weekly price and charts AonPlc Strong weekly Stock price targets for AonPlc AON are 338.1 and 351.6 | Weekly Target 1 | 334.89 | | Weekly Target 2 | 341.3 | | Weekly Target 3 | 348.39 | | Weekly Target 4 | 354.8 | | Weekly Target 5 | 361.89 |
Weekly price and volumes for Aon Plc
| Date |
Closing |
Open |
Range |
Volume |
Thu 04 December 2025 |
347.71 (-1.75%) |
352.69 |
341.98 - 355.48 |
0.7054 times |
Fri 28 November 2025 |
353.92 (2.14%) |
347.23 |
342.80 - 355.62 |
0.4617 times |
Fri 21 November 2025 |
346.51 (-1.03%) |
350.00 |
339.17 - 353.00 |
1.4358 times |
Fri 14 November 2025 |
350.13 (1.1%) |
343.34 |
341.02 - 354.24 |
1.0955 times |
Fri 07 November 2025 |
346.32 (1.66%) |
340.11 |
337.82 - 348.18 |
0.955 times |
Fri 31 October 2025 |
340.68 (0%) |
336.43 |
334.80 - 348.61 |
0.4878 times |
Fri 31 October 2025 |
340.68 (0.87%) |
337.00 |
324.28 - 348.61 |
1.756 times |
Fri 24 October 2025 |
337.73 (-2.56%) |
347.22 |
337.34 - 347.22 |
1.0283 times |
Fri 17 October 2025 |
346.60 (-3.76%) |
357.11 |
337.92 - 360.82 |
1.298 times |
Fri 10 October 2025 |
360.15 (-1.01%) |
364.07 |
359.18 - 370.31 |
0.7765 times |
Fri 03 October 2025 |
363.81 (2.17%) |
355.01 |
351.80 - 365.98 |
0.9026 times |
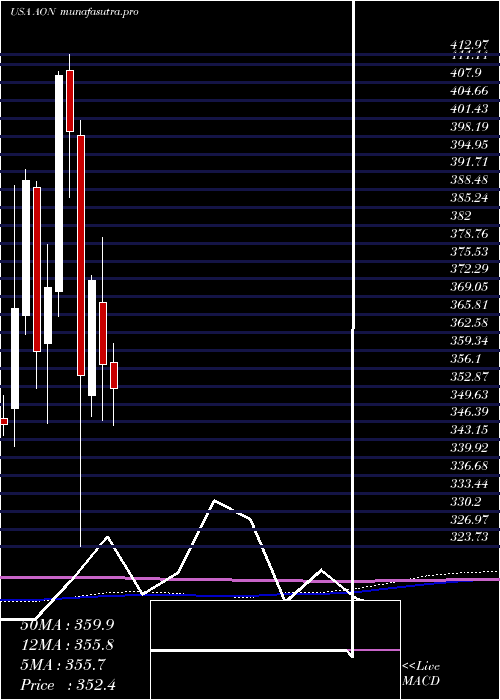
Monthly price and charts AonPlc Strong monthly Stock price targets for AonPlc AON are 338.1 and 351.6 | Monthly Target 1 | 334.89 | | Monthly Target 2 | 341.3 | | Monthly Target 3 | 348.39 | | Monthly Target 4 | 354.8 | | Monthly Target 5 | 361.89 |
Monthly price and volumes Aon Plc
| Date |
Closing |
Open |
Range |
Volume |
Thu 04 December 2025 |
347.71 (-1.75%) |
352.69 |
341.98 - 355.48 |
0.1426 times |
Fri 28 November 2025 |
353.92 (3.89%) |
340.11 |
337.82 - 355.62 |
0.7982 times |
Fri 31 October 2025 |
340.68 (-4.46%) |
355.15 |
324.28 - 370.31 |
1.18 times |
Tue 30 September 2025 |
356.58 (-2.84%) |
367.63 |
348.64 - 375.87 |
1.0589 times |
Fri 29 August 2025 |
367.00 (3.17%) |
356.68 |
351.44 - 378.70 |
1.0541 times |
Thu 31 July 2025 |
355.71 (-0.29%) |
357.13 |
345.78 - 381.00 |
1.1929 times |
Mon 30 June 2025 |
356.76 (-4.12%) |
368.06 |
346.70 - 379.91 |
1.0518 times |
Fri 30 May 2025 |
372.08 (4.87%) |
351.18 |
347.42 - 372.99 |
0.9833 times |
Wed 30 April 2025 |
354.79 (-11.1%) |
398.41 |
323.73 - 401.03 |
1.52 times |
Mon 31 March 2025 |
399.09 (-2.45%) |
410.15 |
387.16 - 412.97 |
1.0182 times |
Fri 28 February 2025 |
409.12 (10.33%) |
370.08 |
365.44 - 409.99 |
0.8081 times |
DMA SMA EMA moving averages of Aon Plc AON
DMA (daily moving average) of Aon Plc AON
| DMA period | DMA value | | 5 day DMA | 348.59 | | 12 day DMA | 348.01 | | 20 day DMA | 347.92 | | 35 day DMA | 344.18 | | 50 day DMA | 348.76 | | 100 day DMA | 356.23 | | 150 day DMA | 356.92 | | 200 day DMA | 363.95 | EMA (exponential moving average) of Aon Plc AON
| EMA period | EMA current | EMA prev | EMA prev2 | | 5 day EMA | 347.65 | 347.62 | 349.21 | | 12 day EMA | 347.88 | 347.91 | 348.54 | | 20 day EMA | 347.46 | 347.43 | 347.74 | | 35 day EMA | 348.67 | 348.73 | 348.98 | | 50 day EMA | 349.06 | 349.11 | 349.3 |
SMA (simple moving average) of Aon Plc AON
| SMA period | SMA current | SMA prev | SMA prev2 | | 5 day SMA | 348.59 | 349.57 | 350.87 | | 12 day SMA | 348.01 | 348.2 | 348.68 | | 20 day SMA | 347.92 | 347.62 | 347.61 | | 35 day SMA | 344.18 | 344.41 | 344.87 | | 50 day SMA | 348.76 | 348.88 | 349.05 | | 100 day SMA | 356.23 | 356.28 | 356.43 | | 150 day SMA | 356.92 | 356.96 | 357 | | 200 day SMA | 363.95 | 364.15 | 364.38 |
|
|
