AberdeenTotal AOD full analysis,charts,indicators,moving averages,SMA,DMA,EMA,ADX,MACD,RSIAberdeen Total AOD WideScreen charts, DMA,SMA,EMA technical analysis, forecast prediction, by indicators ADX,MACD,RSI,CCI USA stock exchange
operates under N A sector & deals in N A
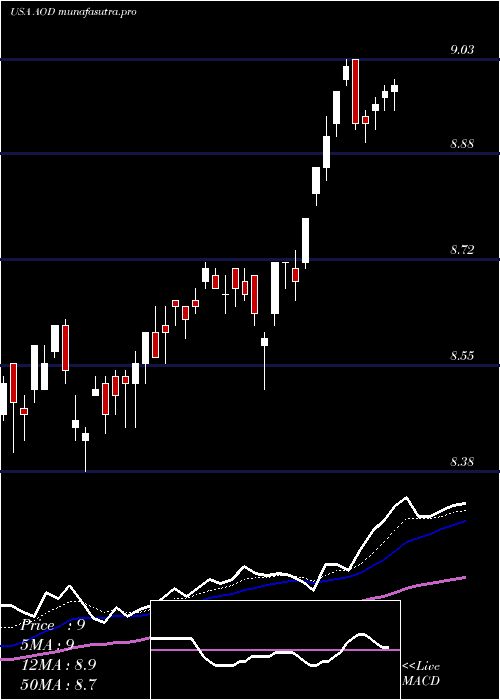
Daily price and charts and targets AberdeenTotal Strong Daily Stock price targets for AberdeenTotal AOD are 9.65 and 9.71 | Daily Target 1 | 9.61 | | Daily Target 2 | 9.65 | | Daily Target 3 | 9.6733333333333 | | Daily Target 4 | 9.71 | | Daily Target 5 | 9.73 |
Daily price and volume Aberdeen Total
| Date |
Closing |
Open |
Range |
Volume |
Thu 04 December 2025 |
9.68 (0.41%) |
9.68 |
9.64 - 9.70 |
0.6665 times |
Wed 03 December 2025 |
9.64 (0.42%) |
9.61 |
9.57 - 9.65 |
0.7524 times |
Tue 02 December 2025 |
9.60 (-0.21%) |
9.63 |
9.57 - 9.66 |
0.9014 times |
Mon 01 December 2025 |
9.62 (-0.41%) |
9.63 |
9.61 - 9.67 |
0.9 times |
Fri 28 November 2025 |
9.66 (1.15%) |
9.61 |
9.60 - 9.66 |
1.0439 times |
Wed 26 November 2025 |
9.55 (2.25%) |
9.41 |
9.41 - 9.55 |
1.0153 times |
Tue 25 November 2025 |
9.34 (0.21%) |
9.34 |
9.29 - 9.38 |
1.1618 times |
Mon 24 November 2025 |
9.32 (0.65%) |
9.29 |
9.28 - 9.35 |
0.781 times |
Fri 21 November 2025 |
9.26 (-0.32%) |
9.24 |
9.19 - 9.28 |
1.4334 times |
Thu 20 November 2025 |
9.29 (-0.75%) |
9.40 |
9.29 - 9.51 |
1.3441 times |
Wed 19 November 2025 |
9.36 (0.43%) |
9.36 |
9.26 - 9.39 |
0.981 times |
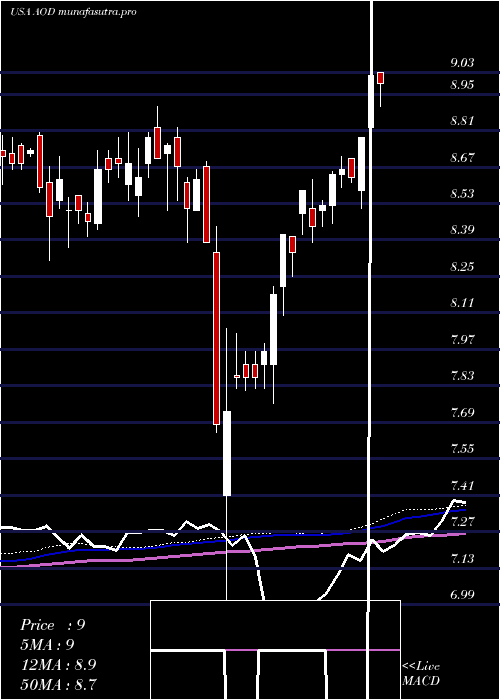
Weekly price and charts AberdeenTotal Strong weekly Stock price targets for AberdeenTotal AOD are 9.63 and 9.76 | Weekly Target 1 | 9.52 | | Weekly Target 2 | 9.6 | | Weekly Target 3 | 9.65 | | Weekly Target 4 | 9.73 | | Weekly Target 5 | 9.78 |
Weekly price and volumes for Aberdeen Total
| Date |
Closing |
Open |
Range |
Volume |
Thu 04 December 2025 |
9.68 (0.21%) |
9.63 |
9.57 - 9.70 |
0.6787 times |
Fri 28 November 2025 |
9.66 (4.32%) |
9.29 |
9.28 - 9.66 |
0.8435 times |
Fri 21 November 2025 |
9.26 (-1.8%) |
9.42 |
9.19 - 9.51 |
1.1834 times |
Fri 14 November 2025 |
9.43 (2.5%) |
9.29 |
9.27 - 9.55 |
0.8422 times |
Fri 07 November 2025 |
9.20 (-4.07%) |
9.52 |
9.13 - 9.53 |
1.2271 times |
Fri 31 October 2025 |
9.59 (0%) |
9.60 |
9.52 - 9.66 |
0.2672 times |
Fri 31 October 2025 |
9.59 (-0.72%) |
9.68 |
9.49 - 9.71 |
1.1513 times |
Fri 24 October 2025 |
9.66 (0.63%) |
9.65 |
9.59 - 9.75 |
1.2736 times |
Fri 17 October 2025 |
9.60 (2.02%) |
9.52 |
9.33 - 9.66 |
1.2607 times |
Fri 10 October 2025 |
9.41 (-1.47%) |
9.57 |
9.41 - 9.72 |
1.2724 times |
Fri 03 October 2025 |
9.55 (1.92%) |
9.39 |
9.36 - 9.60 |
1.0851 times |
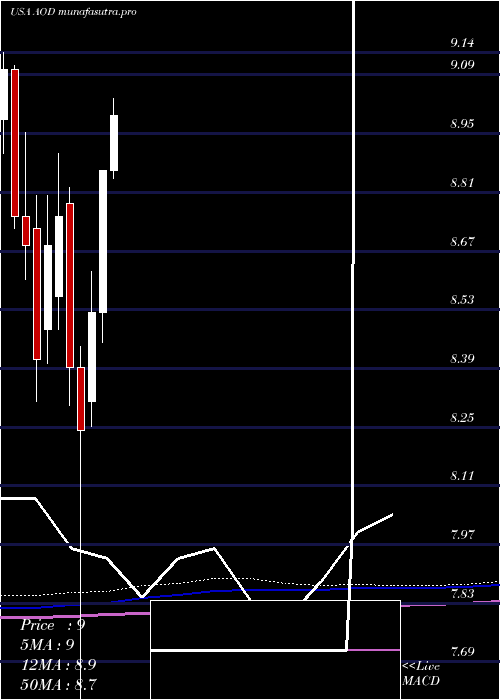
Monthly price and charts AberdeenTotal Strong monthly Stock price targets for AberdeenTotal AOD are 9.63 and 9.76 | Monthly Target 1 | 9.52 | | Monthly Target 2 | 9.6 | | Monthly Target 3 | 9.65 | | Monthly Target 4 | 9.73 | | Monthly Target 5 | 9.78 |
Monthly price and volumes Aberdeen Total
| Date |
Closing |
Open |
Range |
Volume |
Thu 04 December 2025 |
9.68 (0.21%) |
9.63 |
9.57 - 9.70 |
0.1706 times |
Fri 28 November 2025 |
9.66 (0.73%) |
9.52 |
9.13 - 9.66 |
1.0295 times |
Fri 31 October 2025 |
9.59 (1.37%) |
9.46 |
9.33 - 9.75 |
1.4655 times |
Tue 30 September 2025 |
9.46 (3.61%) |
9.08 |
9.01 - 9.50 |
1.0544 times |
Fri 29 August 2025 |
9.13 (2.24%) |
8.90 |
8.77 - 9.19 |
1.1441 times |
Thu 31 July 2025 |
8.93 (0.79%) |
8.86 |
8.84 - 9.14 |
1.0575 times |
Mon 30 June 2025 |
8.86 (3.99%) |
8.52 |
8.45 - 8.86 |
0.888 times |
Fri 30 May 2025 |
8.52 (3.4%) |
8.31 |
8.25 - 8.62 |
1.0905 times |
Wed 30 April 2025 |
8.24 (-1.79%) |
8.39 |
6.99 - 8.44 |
1.2073 times |
Mon 31 March 2025 |
8.39 (-4.11%) |
8.78 |
8.30 - 8.82 |
0.8925 times |
Fri 28 February 2025 |
8.75 (0.81%) |
8.56 |
8.48 - 8.90 |
0.7655 times |
DMA SMA EMA moving averages of Aberdeen Total AOD
DMA (daily moving average) of Aberdeen Total AOD
| DMA period | DMA value | | 5 day DMA | 9.64 | | 12 day DMA | 9.47 | | 20 day DMA | 9.44 | | 35 day DMA | 9.51 | | 50 day DMA | 9.51 | | 100 day DMA | 9.32 | | 150 day DMA | 9.09 | | 200 day DMA | 8.89 | EMA (exponential moving average) of Aberdeen Total AOD
| EMA period | EMA current | EMA prev | EMA prev2 | | 5 day EMA | 9.61 | 9.58 | 9.55 | | 12 day EMA | 9.54 | 9.51 | 9.49 | | 20 day EMA | 9.5 | 9.48 | 9.46 | | 35 day EMA | 9.5 | 9.49 | 9.48 | | 50 day EMA | 9.52 | 9.51 | 9.5 |
SMA (simple moving average) of Aberdeen Total AOD
| SMA period | SMA current | SMA prev | SMA prev2 | | 5 day SMA | 9.64 | 9.61 | 9.55 | | 12 day SMA | 9.47 | 9.44 | 9.42 | | 20 day SMA | 9.44 | 9.43 | 9.42 | | 35 day SMA | 9.51 | 9.51 | 9.5 | | 50 day SMA | 9.51 | 9.51 | 9.5 | | 100 day SMA | 9.32 | 9.32 | 9.31 | | 150 day SMA | 9.09 | 9.08 | 9.07 | | 200 day SMA | 8.89 | 8.89 | 8.89 |
|
|
