AngiodynamicsInc ANGO full analysis,charts,indicators,moving averages,SMA,DMA,EMA,ADX,MACD,RSIAngiodynamics Inc ANGO WideScreen charts, DMA,SMA,EMA technical analysis, forecast prediction, by indicators ADX,MACD,RSI,CCI USA stock exchange
operates under Health Care sector & deals in Medical Dental Instruments
Daily price and charts and targets AngiodynamicsInc Strong Daily Stock price targets for AngiodynamicsInc ANGO are 11.71 and 12.07 | Daily Target 1 | 11.43 | | Daily Target 2 | 11.62 | | Daily Target 3 | 11.786666666667 | | Daily Target 4 | 11.98 | | Daily Target 5 | 12.15 |
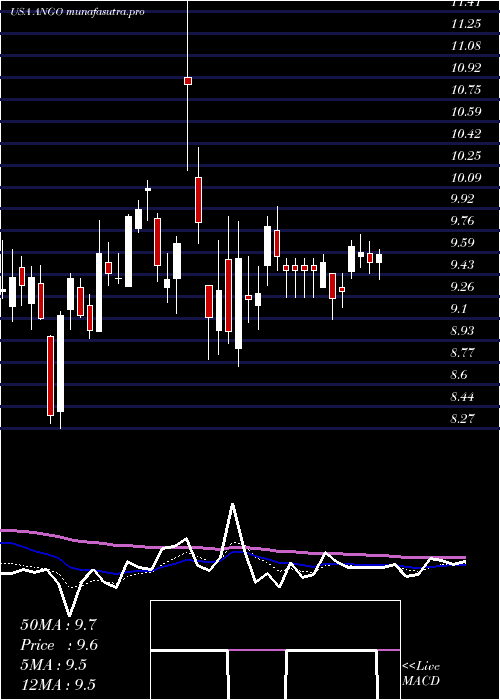
Daily price and volume Angiodynamics Inc
| Date |
Closing |
Open |
Range |
Volume |
Mon 20 October 2025 |
11.82 (2.43%) |
11.72 |
11.59 - 11.95 |
0.8428 times |
Fri 17 October 2025 |
11.54 (-1.54%) |
11.68 |
11.42 - 11.84 |
0.9133 times |
Thu 16 October 2025 |
11.72 (-0.93%) |
11.90 |
11.68 - 12.21 |
1.5359 times |
Wed 15 October 2025 |
11.83 (3.68%) |
11.48 |
11.43 - 11.88 |
1.3297 times |
Tue 14 October 2025 |
11.41 (2.52%) |
11.21 |
10.97 - 11.44 |
0.9785 times |
Mon 13 October 2025 |
11.13 (1.18%) |
11.04 |
10.90 - 11.62 |
0.8373 times |
Fri 10 October 2025 |
11.00 (-1.26%) |
11.75 |
10.99 - 12.00 |
1.0367 times |
Thu 09 October 2025 |
11.14 (0.18%) |
11.12 |
10.98 - 11.26 |
0.7097 times |
Wed 08 October 2025 |
11.12 (0.63%) |
11.13 |
10.93 - 11.16 |
0.6895 times |
Tue 07 October 2025 |
11.05 (-0.81%) |
11.31 |
10.78 - 11.35 |
1.1267 times |
Mon 06 October 2025 |
11.14 (-4.3%) |
11.98 |
11.13 - 11.98 |
0.9321 times |
Weekly price and charts AngiodynamicsInc Strong weekly Stock price targets for AngiodynamicsInc ANGO are 11.71 and 12.07 | Weekly Target 1 | 11.43 | | Weekly Target 2 | 11.62 | | Weekly Target 3 | 11.786666666667 | | Weekly Target 4 | 11.98 | | Weekly Target 5 | 12.15 |
Weekly price and volumes for Angiodynamics Inc
| Date |
Closing |
Open |
Range |
Volume |
Mon 20 October 2025 |
11.82 (2.43%) |
11.72 |
11.59 - 11.95 |
0.1982 times |
Fri 17 October 2025 |
11.54 (4.91%) |
11.04 |
10.90 - 12.21 |
1.3155 times |
Fri 10 October 2025 |
11.00 (-5.5%) |
11.98 |
10.78 - 12.00 |
1.0568 times |
Fri 03 October 2025 |
11.64 (8.99%) |
10.77 |
10.65 - 12.76 |
2.8079 times |
Fri 26 September 2025 |
10.68 (-0.84%) |
10.75 |
10.40 - 11.00 |
0.7285 times |
Fri 19 September 2025 |
10.77 (1.13%) |
10.65 |
10.34 - 11.09 |
0.8993 times |
Fri 12 September 2025 |
10.65 (-0.75%) |
10.79 |
10.53 - 11.11 |
1.0993 times |
Fri 05 September 2025 |
10.73 (4.58%) |
10.13 |
10.13 - 10.90 |
0.8428 times |
Fri 29 August 2025 |
10.26 (0%) |
10.13 |
10.03 - 10.30 |
0.2351 times |
Fri 29 August 2025 |
10.26 (8.57%) |
9.45 |
9.42 - 10.30 |
0.8167 times |
Fri 22 August 2025 |
9.45 (7.75%) |
8.75 |
8.65 - 9.57 |
0.8902 times |
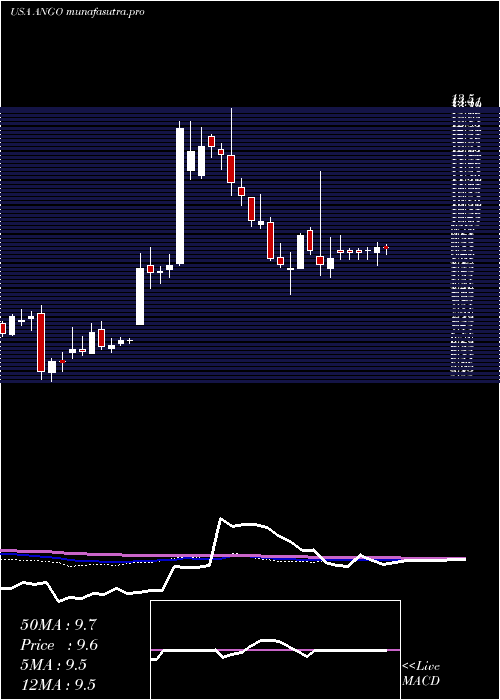
Monthly price and charts AngiodynamicsInc Strong monthly Stock price targets for AngiodynamicsInc ANGO are 11.3 and 13.28 | Monthly Target 1 | 9.81 | | Monthly Target 2 | 10.81 | | Monthly Target 3 | 11.786666666667 | | Monthly Target 4 | 12.79 | | Monthly Target 5 | 13.77 |
Monthly price and volumes Angiodynamics Inc
| Date |
Closing |
Open |
Range |
Volume |
Mon 20 October 2025 |
11.82 (5.82%) |
11.17 |
10.78 - 12.76 |
0.8111 times |
Tue 30 September 2025 |
11.17 (8.87%) |
10.13 |
10.13 - 11.19 |
0.6522 times |
Fri 29 August 2025 |
10.26 (15.8%) |
8.79 |
8.36 - 10.30 |
0.6296 times |
Thu 31 July 2025 |
8.86 (-10.69%) |
9.86 |
8.38 - 10.80 |
1.431 times |
Mon 30 June 2025 |
9.92 (-2.75%) |
10.16 |
9.36 - 12.11 |
1.1278 times |
Fri 30 May 2025 |
10.20 (9.8%) |
9.27 |
8.55 - 10.40 |
0.7141 times |
Wed 30 April 2025 |
9.29 (-1.06%) |
9.40 |
8.74 - 11.72 |
0.974 times |
Mon 31 March 2025 |
9.39 (1.08%) |
9.30 |
8.27 - 10.14 |
0.7344 times |
Fri 28 February 2025 |
9.29 (-18.58%) |
11.27 |
9.23 - 11.54 |
0.7375 times |
Fri 31 January 2025 |
11.41 (24.56%) |
9.21 |
8.76 - 13.50 |
2.1883 times |
Tue 31 December 2024 |
9.16 (31.04%) |
7.44 |
7.44 - 9.58 |
0.9004 times |

DMA SMA EMA moving averages of Angiodynamics Inc ANGO
DMA (daily moving average) of Angiodynamics Inc ANGO
| DMA period | DMA value | | 5 day DMA | 11.66 | | 12 day DMA | 11.38 | | 20 day DMA | 11.19 | | 35 day DMA | 11 | | 50 day DMA | 10.52 | | 100 day DMA | 10.07 | | 150 day DMA | 9.86 | | 200 day DMA | 10.1 | EMA (exponential moving average) of Angiodynamics Inc ANGO
| EMA period | EMA current | EMA prev | EMA prev2 | | 5 day EMA | 11.63 | 11.53 | 11.52 | | 12 day EMA | 11.41 | 11.34 | 11.3 | | 20 day EMA | 11.22 | 11.16 | 11.12 | | 35 day EMA | 10.84 | 10.78 | 10.74 | | 50 day EMA | 10.47 | 10.42 | 10.37 |
SMA (simple moving average) of Angiodynamics Inc ANGO
| SMA period | SMA current | SMA prev | SMA prev2 | | 5 day SMA | 11.66 | 11.53 | 11.42 | | 12 day SMA | 11.38 | 11.35 | 11.31 | | 20 day SMA | 11.19 | 11.13 | 11.09 | | 35 day SMA | 11 | 10.96 | 10.92 | | 50 day SMA | 10.52 | 10.45 | 10.39 | | 100 day SMA | 10.07 | 10.05 | 10.03 | | 150 day SMA | 9.86 | 9.85 | 9.83 | | 200 day SMA | 10.1 | 10.08 | 10.07 |
|
|
