AbercrombieFitch ANF full analysis,charts,indicators,moving averages,SMA,DMA,EMA,ADX,MACD,RSIAbercrombie Fitch ANF WideScreen charts, DMA,SMA,EMA technical analysis, forecast prediction, by indicators ADX,MACD,RSI,CCI USA stock exchange
operates under Consumer Services sector & deals in Clothing Shoe Accessory Stores
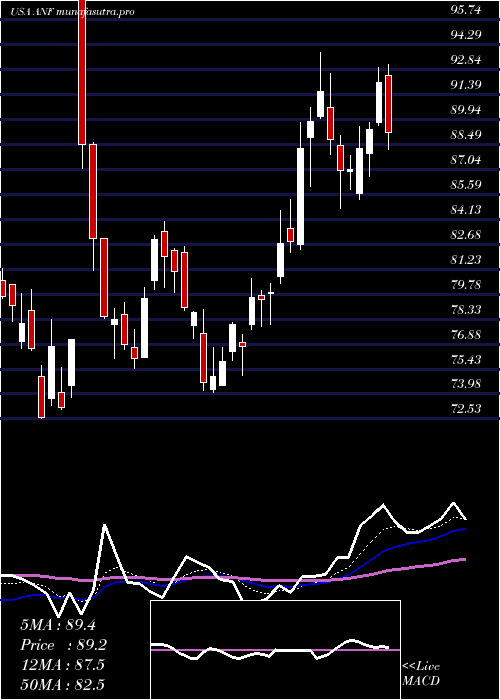
Daily price and charts and targets AbercrombieFitch Strong Daily Stock price targets for AbercrombieFitch ANF are 65.17 and 68.01 | Daily Target 1 | 64.68 | | Daily Target 2 | 65.66 | | Daily Target 3 | 67.52 | | Daily Target 4 | 68.5 | | Daily Target 5 | 70.36 |
Daily price and volume Abercrombie Fitch
| Date |
Closing |
Open |
Range |
Volume |
Mon 20 October 2025 |
66.64 (-2.77%) |
68.99 |
66.54 - 69.38 |
0.7546 times |
Fri 17 October 2025 |
68.54 (-0.94%) |
68.01 |
67.90 - 69.80 |
0.7401 times |
Thu 16 October 2025 |
69.19 (-2.7%) |
71.64 |
68.72 - 71.64 |
0.8341 times |
Wed 15 October 2025 |
71.11 (-1.84%) |
72.81 |
71.10 - 73.55 |
1.1063 times |
Tue 14 October 2025 |
72.44 (-0.63%) |
72.00 |
71.50 - 72.99 |
0.9648 times |
Mon 13 October 2025 |
72.90 (-0.63%) |
75.28 |
72.85 - 75.61 |
1.4139 times |
Fri 10 October 2025 |
73.36 (-4.62%) |
77.12 |
72.90 - 77.15 |
1.0913 times |
Thu 09 October 2025 |
76.91 (1%) |
75.90 |
75.53 - 76.94 |
0.7156 times |
Wed 08 October 2025 |
76.15 (0.93%) |
75.50 |
75.08 - 76.25 |
0.9418 times |
Tue 07 October 2025 |
75.45 (-3.42%) |
78.00 |
75.45 - 78.10 |
1.4376 times |
Mon 06 October 2025 |
78.12 (-7.53%) |
84.33 |
77.50 - 84.35 |
1.6048 times |
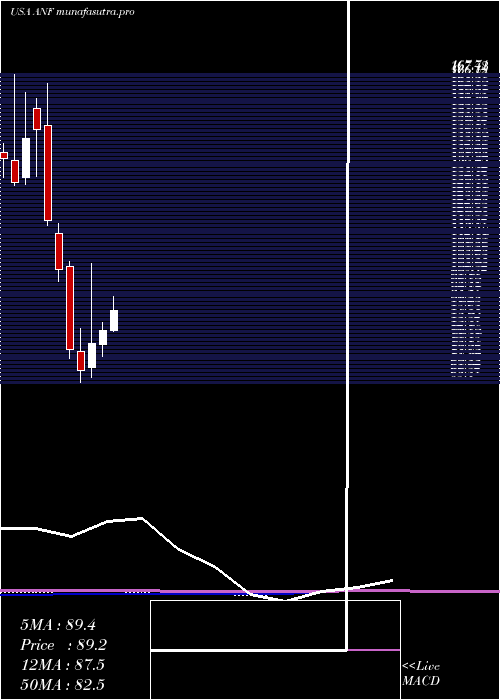
Weekly price and charts AbercrombieFitch Strong weekly Stock price targets for AbercrombieFitch ANF are 65.17 and 68.01 | Weekly Target 1 | 64.68 | | Weekly Target 2 | 65.66 | | Weekly Target 3 | 67.52 | | Weekly Target 4 | 68.5 | | Weekly Target 5 | 70.36 |
Weekly price and volumes for Abercrombie Fitch
| Date |
Closing |
Open |
Range |
Volume |
Mon 20 October 2025 |
66.64 (-2.77%) |
68.99 |
66.54 - 69.38 |
0.183 times |
Fri 17 October 2025 |
68.54 (-6.57%) |
75.28 |
67.90 - 75.61 |
1.227 times |
Fri 10 October 2025 |
73.36 (-13.16%) |
84.33 |
72.90 - 84.35 |
1.4044 times |
Fri 03 October 2025 |
84.48 (-1.64%) |
86.25 |
83.84 - 87.30 |
0.8297 times |
Fri 26 September 2025 |
85.89 (-5.51%) |
91.08 |
85.85 - 91.15 |
0.9772 times |
Fri 19 September 2025 |
90.90 (3.91%) |
88.00 |
84.20 - 93.00 |
1.2469 times |
Fri 12 September 2025 |
87.48 (-8.27%) |
96.28 |
87.42 - 98.35 |
1.0438 times |
Fri 05 September 2025 |
95.37 (1.97%) |
92.85 |
89.92 - 97.00 |
0.8654 times |
Fri 29 August 2025 |
93.53 (0%) |
97.07 |
92.12 - 97.20 |
0.2644 times |
Fri 29 August 2025 |
93.53 (-5.01%) |
98.77 |
86.76 - 100.61 |
1.9582 times |
Fri 22 August 2025 |
98.46 (4.95%) |
95.07 |
89.31 - 98.73 |
1.1678 times |
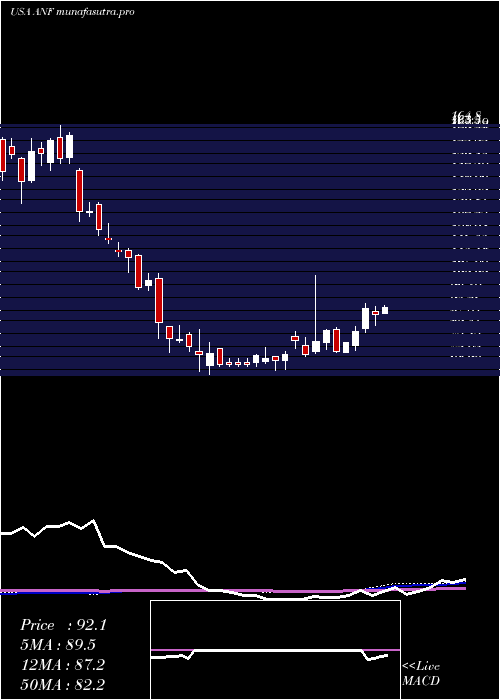
Monthly price and charts AbercrombieFitch Strong monthly Stock price targets for AbercrombieFitch ANF are 56.21 and 76.97 | Monthly Target 1 | 52.73 | | Monthly Target 2 | 59.69 | | Monthly Target 3 | 73.493333333333 | | Monthly Target 4 | 80.45 | | Monthly Target 5 | 94.25 |
Monthly price and volumes Abercrombie Fitch
| Date |
Closing |
Open |
Range |
Volume |
Mon 20 October 2025 |
66.64 (-22.1%) |
85.18 |
66.54 - 87.30 |
0.5957 times |
Tue 30 September 2025 |
85.55 (-8.53%) |
92.85 |
83.84 - 98.35 |
0.7982 times |
Fri 29 August 2025 |
93.53 (-2.59%) |
93.24 |
86.76 - 105.52 |
1.0153 times |
Thu 31 July 2025 |
96.02 (15.9%) |
82.67 |
82.38 - 100.75 |
0.9222 times |
Mon 30 June 2025 |
82.85 (5.55%) |
78.00 |
74.04 - 85.29 |
0.8955 times |
Fri 30 May 2025 |
78.49 (13.07%) |
70.36 |
67.20 - 104.99 |
1.5068 times |
Wed 30 April 2025 |
69.42 (-9.1%) |
75.71 |
65.40 - 83.46 |
1.1632 times |
Mon 31 March 2025 |
76.37 (-25.85%) |
103.86 |
73.39 - 105.77 |
1.2351 times |
Fri 28 February 2025 |
102.99 (-13.73%) |
115.07 |
99.12 - 118.24 |
0.7735 times |
Fri 31 January 2025 |
119.38 (-20.13%) |
150.79 |
117.61 - 164.80 |
1.0944 times |
Tue 31 December 2024 |
149.47 (1.94%) |
156.55 |
133.81 - 159.83 |
0.647 times |
DMA SMA EMA moving averages of Abercrombie Fitch ANF
DMA (daily moving average) of Abercrombie Fitch ANF
| DMA period | DMA value | | 5 day DMA | 69.58 | | 12 day DMA | 73.77 | | 20 day DMA | 78.88 | | 35 day DMA | 84.22 | | 50 day DMA | 87.82 | | 100 day DMA | 87.72 | | 150 day DMA | 83.24 | | 200 day DMA | 90.65 | EMA (exponential moving average) of Abercrombie Fitch ANF
| EMA period | EMA current | EMA prev | EMA prev2 | | 5 day EMA | 69.42 | 70.81 | 71.94 | | 12 day EMA | 73.57 | 74.83 | 75.97 | | 20 day EMA | 77.29 | 78.41 | 79.45 | | 35 day EMA | 82.43 | 83.36 | 84.23 | | 50 day EMA | 87.13 | 87.97 | 88.76 |
SMA (simple moving average) of Abercrombie Fitch ANF
| SMA period | SMA current | SMA prev | SMA prev2 | | 5 day SMA | 69.58 | 70.84 | 71.8 | | 12 day SMA | 73.77 | 75.36 | 76.83 | | 20 day SMA | 78.88 | 79.93 | 81.05 | | 35 day SMA | 84.22 | 84.99 | 85.7 | | 50 day SMA | 87.82 | 88.49 | 89.18 | | 100 day SMA | 87.72 | 87.82 | 87.87 | | 150 day SMA | 83.24 | 83.35 | 83.42 | | 200 day SMA | 90.65 | 91.11 | 91.53 |
|
|
