AndersonsInc ANDE full analysis,charts,indicators,moving averages,SMA,DMA,EMA,ADX,MACD,RSIAndersons Inc ANDE WideScreen charts, DMA,SMA,EMA technical analysis, forecast prediction, by indicators ADX,MACD,RSI,CCI USA stock exchange
operates under Consumer Services sector & deals in Farming Seeds Milling
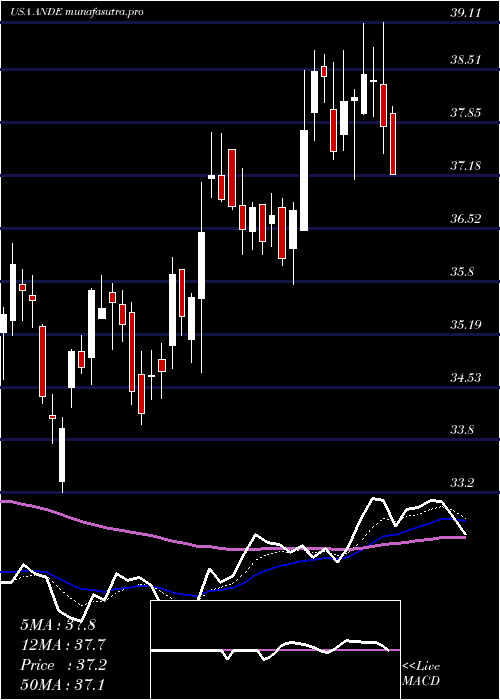
Daily price and charts and targets AndersonsInc Strong Daily Stock price targets for AndersonsInc ANDE are 45.31 and 46.77 | Daily Target 1 | 44.13 | | Daily Target 2 | 45.02 | | Daily Target 3 | 45.593333333333 | | Daily Target 4 | 46.48 | | Daily Target 5 | 47.05 |
Daily price and volume Andersons Inc
| Date |
Closing |
Open |
Range |
Volume |
Wed 22 October 2025 |
45.90 (0.88%) |
45.55 |
44.71 - 46.17 |
1.0996 times |
Tue 21 October 2025 |
45.50 (-4.23%) |
47.24 |
45.35 - 47.64 |
0.8818 times |
Mon 20 October 2025 |
47.51 (0.06%) |
47.51 |
47.15 - 47.81 |
0.563 times |
Fri 17 October 2025 |
47.48 (1.74%) |
46.56 |
46.41 - 47.53 |
1.2057 times |
Thu 16 October 2025 |
46.67 (0.6%) |
46.53 |
45.81 - 46.96 |
1.5045 times |
Wed 15 October 2025 |
46.39 (9.2%) |
42.95 |
42.60 - 47.04 |
1.4654 times |
Tue 14 October 2025 |
42.48 (1.09%) |
42.24 |
41.48 - 42.58 |
0.8211 times |
Mon 13 October 2025 |
42.02 (2.46%) |
41.30 |
41.30 - 42.09 |
0.8175 times |
Fri 10 October 2025 |
41.01 (-1.56%) |
41.49 |
40.81 - 41.95 |
1.0007 times |
Thu 09 October 2025 |
41.66 (-0.19%) |
41.97 |
41.49 - 42.33 |
0.6409 times |
Wed 08 October 2025 |
41.74 (-0.48%) |
42.04 |
41.41 - 42.43 |
0.7304 times |
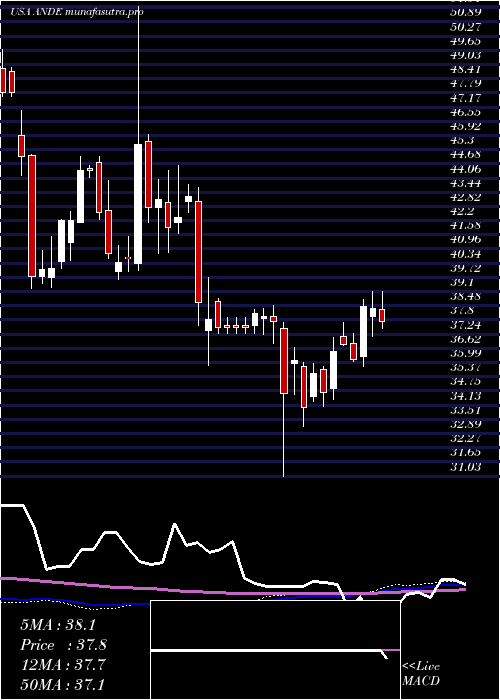
Weekly price and charts AndersonsInc Strong weekly Stock price targets for AndersonsInc ANDE are 43.76 and 46.86 | Weekly Target 1 | 43.04 | | Weekly Target 2 | 44.47 | | Weekly Target 3 | 46.14 | | Weekly Target 4 | 47.57 | | Weekly Target 5 | 49.24 |
Weekly price and volumes for Andersons Inc
| Date |
Closing |
Open |
Range |
Volume |
Wed 22 October 2025 |
45.90 (-3.33%) |
47.51 |
44.71 - 47.81 |
0.4984 times |
Fri 17 October 2025 |
47.48 (15.78%) |
41.30 |
41.30 - 47.53 |
1.1388 times |
Fri 10 October 2025 |
41.01 (-0.68%) |
41.27 |
39.94 - 42.43 |
0.8084 times |
Fri 03 October 2025 |
41.29 (1.62%) |
40.57 |
39.16 - 41.58 |
0.8491 times |
Fri 26 September 2025 |
40.63 (5.18%) |
38.65 |
37.69 - 40.66 |
0.9768 times |
Fri 19 September 2025 |
38.63 (-3.98%) |
39.69 |
38.33 - 40.47 |
3.6115 times |
Fri 12 September 2025 |
40.23 (-2.83%) |
41.68 |
39.15 - 41.68 |
0.7263 times |
Fri 05 September 2025 |
41.40 (1.22%) |
40.68 |
40.06 - 42.36 |
0.6141 times |
Fri 29 August 2025 |
40.90 (0%) |
40.83 |
40.58 - 41.32 |
0.1097 times |
Fri 29 August 2025 |
40.90 (-0.12%) |
40.71 |
39.92 - 41.71 |
0.6668 times |
Fri 22 August 2025 |
40.95 (7.42%) |
38.24 |
37.91 - 41.04 |
0.6765 times |
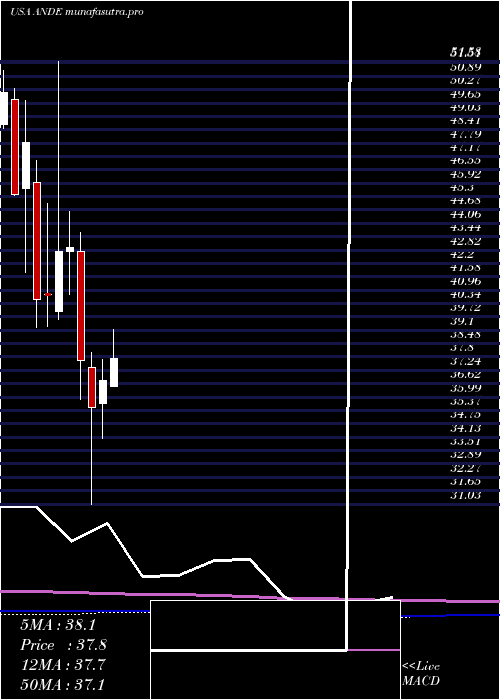
Monthly price and charts AndersonsInc Strong monthly Stock price targets for AndersonsInc ANDE are 42.57 and 51.15 | Monthly Target 1 | 35.73 | | Monthly Target 2 | 40.82 | | Monthly Target 3 | 44.313333333333 | | Monthly Target 4 | 49.4 | | Monthly Target 5 | 52.89 |
Monthly price and volumes Andersons Inc
| Date |
Closing |
Open |
Range |
Volume |
Wed 22 October 2025 |
45.90 (15.3%) |
39.56 |
39.23 - 47.81 |
0.7336 times |
Tue 30 September 2025 |
39.81 (-2.67%) |
40.68 |
37.69 - 42.36 |
1.5823 times |
Fri 29 August 2025 |
40.90 (13.86%) |
35.79 |
31.84 - 41.71 |
0.9441 times |
Thu 31 July 2025 |
35.92 (-2.26%) |
36.50 |
35.53 - 39.11 |
0.859 times |
Mon 30 June 2025 |
36.75 (3.49%) |
35.71 |
34.06 - 37.73 |
0.9549 times |
Fri 30 May 2025 |
35.51 (-5.83%) |
37.37 |
31.03 - 38.08 |
1.0658 times |
Wed 30 April 2025 |
37.71 (-12.16%) |
42.75 |
35.88 - 43.65 |
0.8479 times |
Mon 31 March 2025 |
42.93 (0.35%) |
42.78 |
40.75 - 44.60 |
1.2733 times |
Fri 28 February 2025 |
42.78 (4.98%) |
39.99 |
39.61 - 51.58 |
0.8889 times |
Fri 31 January 2025 |
40.75 (0.57%) |
40.78 |
39.29 - 44.99 |
0.8502 times |
Tue 31 December 2024 |
40.52 (-15.27%) |
45.94 |
39.25 - 47.00 |
1.1959 times |
DMA SMA EMA moving averages of Andersons Inc ANDE
DMA (daily moving average) of Andersons Inc ANDE
| DMA period | DMA value | | 5 day DMA | 46.61 | | 12 day DMA | 44.19 | | 20 day DMA | 42.7 | | 35 day DMA | 41.49 | | 50 day DMA | 40.98 | | 100 day DMA | 38.84 | | 150 day DMA | 38.46 | | 200 day DMA | 39.48 | EMA (exponential moving average) of Andersons Inc ANDE
| EMA period | EMA current | EMA prev | EMA prev2 | | 5 day EMA | 45.93 | 45.94 | 46.16 | | 12 day EMA | 44.58 | 44.34 | 44.13 | | 20 day EMA | 43.44 | 43.18 | 42.94 | | 35 day EMA | 42.27 | 42.06 | 41.86 | | 50 day EMA | 41.37 | 41.18 | 41 |
SMA (simple moving average) of Andersons Inc ANDE
| SMA period | SMA current | SMA prev | SMA prev2 | | 5 day SMA | 46.61 | 46.71 | 46.11 | | 12 day SMA | 44.19 | 43.86 | 43.51 | | 20 day SMA | 42.7 | 42.38 | 42.03 | | 35 day SMA | 41.49 | 41.34 | 41.2 | | 50 day SMA | 40.98 | 40.87 | 40.76 | | 100 day SMA | 38.84 | 38.73 | 38.63 | | 150 day SMA | 38.46 | 38.45 | 38.44 | | 200 day SMA | 39.48 | 39.45 | 39.42 |
|
|
