AutonationInc AN full analysis,charts,indicators,moving averages,SMA,DMA,EMA,ADX,MACD,RSIAutonation Inc AN WideScreen charts, DMA,SMA,EMA technical analysis, forecast prediction, by indicators ADX,MACD,RSI,CCI USA stock exchange
operates under Consumer Durables sector & deals in Automotive Aftermarket
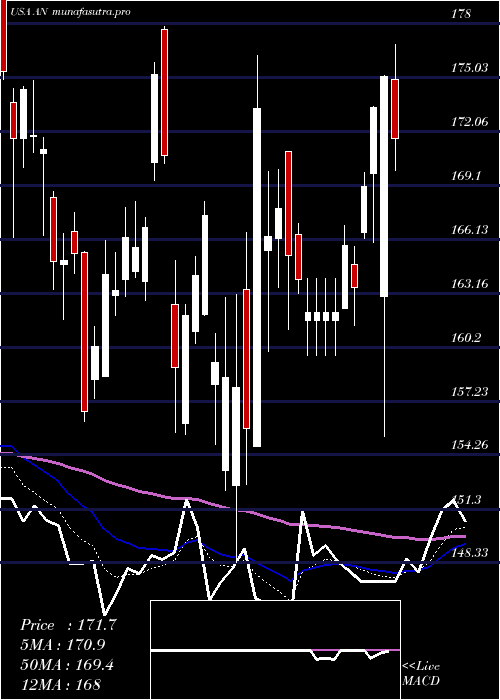
Daily price and charts and targets AutonationInc Strong Daily Stock price targets for AutonationInc AN are 214.33 and 217.04 | Daily Target 1 | 212.26 | | Daily Target 2 | 213.69 | | Daily Target 3 | 214.96666666667 | | Daily Target 4 | 216.4 | | Daily Target 5 | 217.68 |
Daily price and volume Autonation Inc
| Date |
Closing |
Open |
Range |
Volume |
Thu 04 December 2025 |
215.13 (0.37%) |
214.06 |
213.53 - 216.24 |
0.9084 times |
Wed 03 December 2025 |
214.34 (3.31%) |
208.73 |
208.38 - 214.75 |
1.0345 times |
Tue 02 December 2025 |
207.47 (-1.36%) |
211.30 |
207.32 - 212.65 |
0.9166 times |
Mon 01 December 2025 |
210.33 (-0.45%) |
209.51 |
207.72 - 214.15 |
0.9695 times |
Fri 28 November 2025 |
211.29 (0.33%) |
210.70 |
210.50 - 213.19 |
0.4935 times |
Wed 26 November 2025 |
210.59 (-2.18%) |
215.14 |
210.49 - 216.58 |
1.0057 times |
Tue 25 November 2025 |
215.29 (3.06%) |
210.99 |
208.17 - 218.44 |
1.0125 times |
Mon 24 November 2025 |
208.89 (0.93%) |
206.99 |
204.83 - 212.00 |
1.0782 times |
Fri 21 November 2025 |
206.97 (4.39%) |
199.32 |
199.21 - 207.80 |
1.1111 times |
Thu 20 November 2025 |
198.27 (-0.67%) |
200.50 |
196.90 - 204.46 |
1.4701 times |
Wed 19 November 2025 |
199.61 (0.85%) |
197.67 |
196.53 - 200.00 |
0.8818 times |
Weekly price and charts AutonationInc Strong weekly Stock price targets for AutonationInc AN are 211.23 and 220.15 | Weekly Target 1 | 203.98 | | Weekly Target 2 | 209.55 | | Weekly Target 3 | 212.89666666667 | | Weekly Target 4 | 218.47 | | Weekly Target 5 | 221.82 |
Weekly price and volumes for Autonation Inc
| Date |
Closing |
Open |
Range |
Volume |
Thu 04 December 2025 |
215.13 (1.82%) |
209.51 |
207.32 - 216.24 |
0.7925 times |
Fri 28 November 2025 |
211.29 (2.09%) |
206.99 |
204.83 - 218.44 |
0.743 times |
Fri 21 November 2025 |
206.97 (5.27%) |
195.82 |
191.90 - 207.80 |
1.2264 times |
Fri 14 November 2025 |
196.60 (1.41%) |
193.79 |
188.99 - 197.66 |
1.2753 times |
Fri 07 November 2025 |
193.86 (-3.01%) |
197.53 |
187.69 - 197.53 |
1.089 times |
Fri 31 October 2025 |
199.87 (0%) |
196.89 |
195.87 - 200.95 |
0.2886 times |
Fri 31 October 2025 |
199.87 (-0.17%) |
200.89 |
190.52 - 202.45 |
1.7408 times |
Fri 24 October 2025 |
200.21 (-6.75%) |
215.40 |
200.09 - 220.63 |
1.4986 times |
Fri 17 October 2025 |
214.71 (-0.22%) |
214.10 |
213.40 - 222.66 |
1.0578 times |
Tue 07 October 2025 |
215.18 (-4.1%) |
223.87 |
215.04 - 224.82 |
0.2881 times |
Fri 03 October 2025 |
224.38 (3.09%) |
219.69 |
214.93 - 226.63 |
0.9546 times |
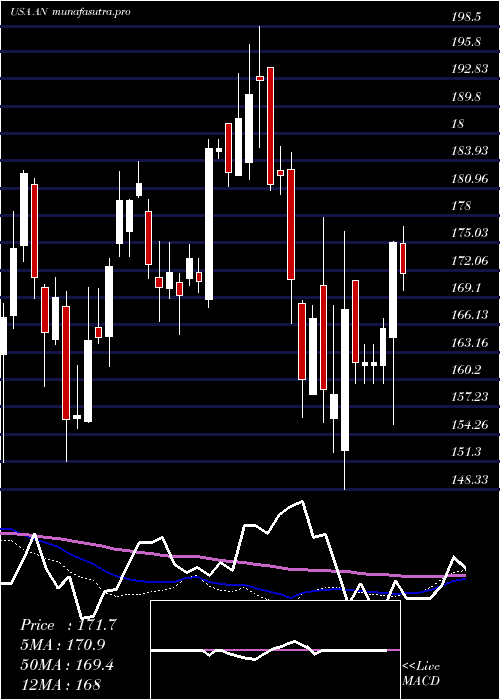
Monthly price and charts AutonationInc Strong monthly Stock price targets for AutonationInc AN are 211.23 and 220.15 | Monthly Target 1 | 203.98 | | Monthly Target 2 | 209.55 | | Monthly Target 3 | 212.89666666667 | | Monthly Target 4 | 218.47 | | Monthly Target 5 | 221.82 |
Monthly price and volumes Autonation Inc
| Date |
Closing |
Open |
Range |
Volume |
Thu 04 December 2025 |
215.13 (1.82%) |
209.51 |
207.32 - 216.24 |
0.1616 times |
Fri 28 November 2025 |
211.29 (5.71%) |
197.53 |
187.69 - 218.44 |
0.8835 times |
Fri 31 October 2025 |
199.87 (-8.64%) |
218.01 |
190.52 - 226.63 |
1.0909 times |
Tue 30 September 2025 |
218.77 (-0.14%) |
216.79 |
208.39 - 228.92 |
1.1274 times |
Fri 29 August 2025 |
219.08 (13.73%) |
190.61 |
188.32 - 224.00 |
0.8755 times |
Thu 31 July 2025 |
192.64 (-3.03%) |
197.93 |
190.41 - 217.40 |
1.4139 times |
Mon 30 June 2025 |
198.65 (8.05%) |
183.48 |
178.17 - 203.18 |
0.8332 times |
Fri 30 May 2025 |
183.85 (5.57%) |
176.26 |
172.70 - 193.24 |
0.9516 times |
Wed 30 April 2025 |
174.15 (7.55%) |
161.05 |
148.33 - 176.83 |
1.3991 times |
Mon 31 March 2025 |
161.92 (-11.21%) |
183.00 |
155.40 - 184.79 |
1.2633 times |
Fri 28 February 2025 |
182.37 (-3.28%) |
183.71 |
180.31 - 198.50 |
1.0704 times |

DMA SMA EMA moving averages of Autonation Inc AN
DMA (daily moving average) of Autonation Inc AN
| DMA period | DMA value | | 5 day DMA | 211.71 | | 12 day DMA | 208.01 | | 20 day DMA | 202.29 | | 35 day DMA | 203.05 | | 50 day DMA | 207.94 | | 100 day DMA | 209.08 | | 150 day DMA | 202.73 | | 200 day DMA | 194.62 | EMA (exponential moving average) of Autonation Inc AN
| EMA period | EMA current | EMA prev | EMA prev2 | | 5 day EMA | 212.21 | 210.75 | 208.96 | | 12 day EMA | 208.47 | 207.26 | 205.97 | | 20 day EMA | 206.37 | 205.45 | 204.51 | | 35 day EMA | 207.4 | 206.95 | 206.52 | | 50 day EMA | 209.31 | 209.07 | 208.86 |
SMA (simple moving average) of Autonation Inc AN
| SMA period | SMA current | SMA prev | SMA prev2 | | 5 day SMA | 211.71 | 210.8 | 210.99 | | 12 day SMA | 208.01 | 206.18 | 204.7 | | 20 day SMA | 202.29 | 201.21 | 200.21 | | 35 day SMA | 203.05 | 203.1 | 203.29 | | 50 day SMA | 207.94 | 208 | 208.13 | | 100 day SMA | 209.08 | 209.08 | 209.07 | | 150 day SMA | 202.73 | 202.46 | 202.19 | | 200 day SMA | 194.62 | 194.5 | 194.4 |
|
|
