AmeripriseFinancial AMP full analysis,charts,indicators,moving averages,SMA,DMA,EMA,ADX,MACD,RSIAmeriprise Financial AMP WideScreen charts, DMA,SMA,EMA technical analysis, forecast prediction, by indicators ADX,MACD,RSI,CCI USA stock exchange
operates under Finance sector & deals in Investment Managers
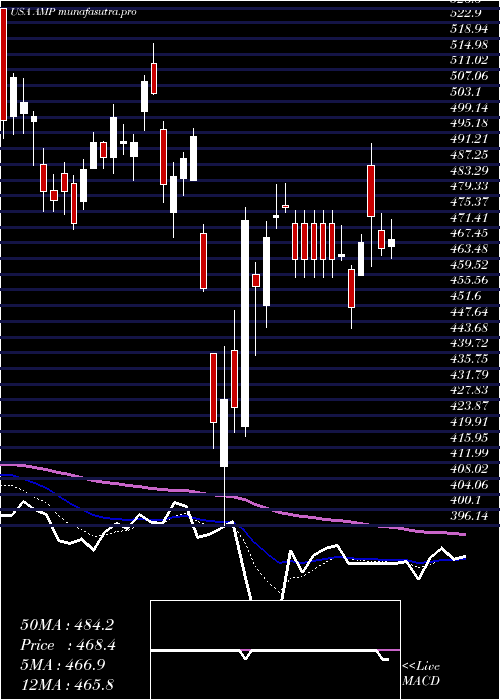
Daily price and charts and targets AmeripriseFinancial Strong Daily Stock price targets for AmeripriseFinancial AMP are 472.36 and 477.05 | Daily Target 1 | 469.12 | | Daily Target 2 | 470.9 | | Daily Target 3 | 473.81 | | Daily Target 4 | 475.59 | | Daily Target 5 | 478.5 |
Daily price and volume Ameriprise Financial
| Date |
Closing |
Open |
Range |
Volume |
Mon 20 October 2025 |
472.68 (0.52%) |
472.03 |
472.03 - 476.72 |
1.3519 times |
Fri 17 October 2025 |
470.25 (0.54%) |
468.05 |
463.00 - 470.71 |
1.8905 times |
Thu 16 October 2025 |
467.73 (-2.81%) |
482.19 |
463.98 - 484.36 |
1.065 times |
Wed 15 October 2025 |
481.27 (-1.08%) |
490.22 |
478.52 - 493.69 |
0.8883 times |
Tue 14 October 2025 |
486.52 (0.98%) |
477.80 |
477.80 - 492.49 |
0.7955 times |
Mon 13 October 2025 |
481.81 (0.5%) |
486.13 |
480.31 - 487.34 |
0.7172 times |
Fri 10 October 2025 |
479.43 (-2.43%) |
493.23 |
478.57 - 496.16 |
0.8173 times |
Thu 09 October 2025 |
491.38 (0.25%) |
493.64 |
487.88 - 495.62 |
0.5761 times |
Wed 08 October 2025 |
490.17 (-1.53%) |
498.41 |
489.82 - 498.41 |
0.9596 times |
Tue 07 October 2025 |
497.79 (0.81%) |
497.07 |
494.14 - 500.48 |
0.9387 times |
Mon 06 October 2025 |
493.81 (0.37%) |
493.88 |
488.79 - 496.13 |
0.3184 times |
Weekly price and charts AmeripriseFinancial Strong weekly Stock price targets for AmeripriseFinancial AMP are 472.36 and 477.05 | Weekly Target 1 | 469.12 | | Weekly Target 2 | 470.9 | | Weekly Target 3 | 473.81 | | Weekly Target 4 | 475.59 | | Weekly Target 5 | 478.5 |
Weekly price and volumes for Ameriprise Financial
| Date |
Closing |
Open |
Range |
Volume |
Mon 20 October 2025 |
472.68 (0.52%) |
472.03 |
472.03 - 476.72 |
0.3621 times |
Fri 17 October 2025 |
470.25 (-1.91%) |
486.13 |
463.00 - 493.69 |
1.4346 times |
Fri 10 October 2025 |
479.43 (-2.55%) |
493.88 |
478.57 - 500.48 |
0.9669 times |
Fri 03 October 2025 |
492.00 (-1.46%) |
499.82 |
481.17 - 501.73 |
1.1543 times |
Fri 26 September 2025 |
499.29 (2%) |
487.65 |
484.38 - 505.55 |
1.1052 times |
Fri 19 September 2025 |
489.52 (-1.52%) |
498.59 |
482.41 - 498.59 |
1.9214 times |
Fri 12 September 2025 |
497.08 (1.59%) |
491.34 |
485.31 - 501.56 |
1.0514 times |
Fri 05 September 2025 |
489.28 (-4.96%) |
509.71 |
487.64 - 513.90 |
0.9199 times |
Fri 29 August 2025 |
514.81 (0%) |
517.18 |
513.52 - 521.83 |
0.1991 times |
Fri 29 August 2025 |
514.81 (-0.41%) |
516.49 |
508.61 - 521.83 |
0.8851 times |
Fri 22 August 2025 |
516.92 (2.75%) |
501.43 |
499.21 - 520.78 |
0.9005 times |
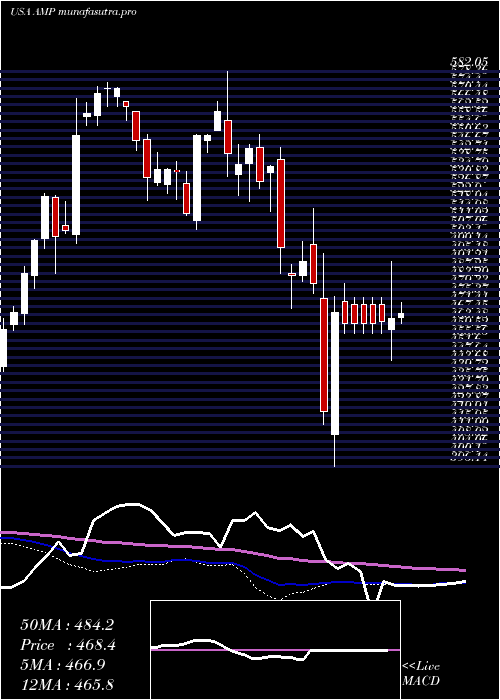
Monthly price and charts AmeripriseFinancial Strong monthly Stock price targets for AmeripriseFinancial AMP are 449.1 and 486.58 | Monthly Target 1 | 441.24 | | Monthly Target 2 | 456.96 | | Monthly Target 3 | 478.72 | | Monthly Target 4 | 494.44 | | Monthly Target 5 | 516.2 |
Monthly price and volumes Ameriprise Financial
| Date |
Closing |
Open |
Range |
Volume |
Mon 20 October 2025 |
472.68 (-3.78%) |
489.70 |
463.00 - 500.48 |
0.6962 times |
Tue 30 September 2025 |
491.25 (-4.58%) |
509.71 |
482.41 - 513.90 |
1.1638 times |
Fri 29 August 2025 |
514.81 (-0.65%) |
508.30 |
496.66 - 521.83 |
0.8197 times |
Thu 31 July 2025 |
518.19 (-2.91%) |
530.89 |
500.91 - 548.47 |
0.9629 times |
Mon 30 June 2025 |
533.73 (4.81%) |
505.02 |
500.08 - 534.34 |
0.9229 times |
Fri 30 May 2025 |
509.24 (8.11%) |
470.73 |
464.87 - 525.56 |
0.9306 times |
Wed 30 April 2025 |
471.02 (-2.7%) |
483.62 |
396.14 - 496.33 |
1.1842 times |
Mon 31 March 2025 |
484.11 (-9.9%) |
541.01 |
468.77 - 546.37 |
1.1023 times |
Fri 28 February 2025 |
537.30 (-1.12%) |
533.50 |
516.40 - 552.43 |
1.0296 times |
Fri 31 January 2025 |
543.36 (2.05%) |
535.50 |
507.97 - 582.05 |
1.1878 times |
Tue 31 December 2024 |
532.43 (-7.24%) |
568.05 |
521.25 - 568.05 |
0.7471 times |

DMA SMA EMA moving averages of Ameriprise Financial AMP
DMA (daily moving average) of Ameriprise Financial AMP
| DMA period | DMA value | | 5 day DMA | 475.69 | | 12 day DMA | 483.74 | | 20 day DMA | 487.51 | | 35 day DMA | 490.93 | | 50 day DMA | 497.16 | | 100 day DMA | 509.22 | | 150 day DMA | 500.31 | | 200 day DMA | 507.87 | EMA (exponential moving average) of Ameriprise Financial AMP
| EMA period | EMA current | EMA prev | EMA prev2 | | 5 day EMA | 474.91 | 476.03 | 478.92 | | 12 day EMA | 480.97 | 482.48 | 484.7 | | 20 day EMA | 485.03 | 486.33 | 488.02 | | 35 day EMA | 490.99 | 492.07 | 493.35 | | 50 day EMA | 495.59 | 496.52 | 497.59 |
SMA (simple moving average) of Ameriprise Financial AMP
| SMA period | SMA current | SMA prev | SMA prev2 | | 5 day SMA | 475.69 | 477.52 | 479.35 | | 12 day SMA | 483.74 | 485.24 | 486.6 | | 20 day SMA | 487.51 | 488.59 | 489.56 | | 35 day SMA | 490.93 | 492.13 | 493.4 | | 50 day SMA | 497.16 | 497.84 | 498.53 | | 100 day SMA | 509.22 | 509.67 | 510.01 | | 150 day SMA | 500.31 | 500.45 | 500.55 | | 200 day SMA | 507.87 | 508.18 | 508.48 |
|
|
