AmcEntertainment AMC full analysis,charts,indicators,moving averages,SMA,DMA,EMA,ADX,MACD,RSIAmc Entertainment AMC WideScreen charts, DMA,SMA,EMA technical analysis, forecast prediction, by indicators ADX,MACD,RSI,CCI USA stock exchange
operates under Consumer Services sector & deals in Movies Entertainment
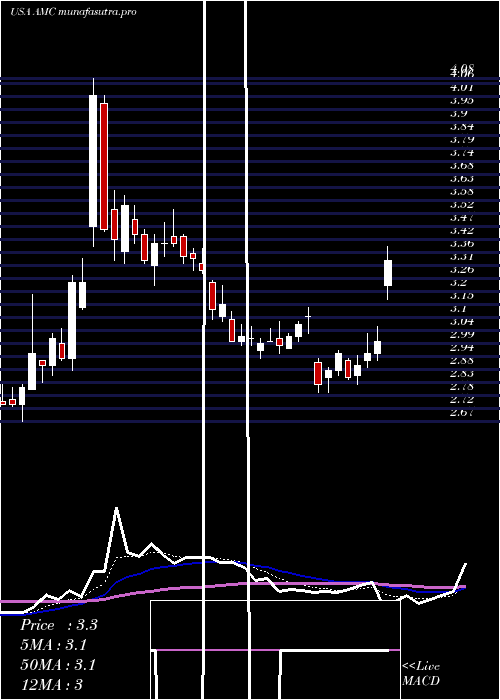
Daily price and charts and targets AmcEntertainment Strong Daily Stock price targets for AmcEntertainment AMC are 2.81 and 3 | Daily Target 1 | 2.66 | | Daily Target 2 | 2.77 | | Daily Target 3 | 2.8466666666667 | | Daily Target 4 | 2.96 | | Daily Target 5 | 3.04 |
Daily price and volume Amc Entertainment
| Date |
Closing |
Open |
Range |
Volume |
Tue 21 October 2025 |
2.89 (4.33%) |
2.76 |
2.73 - 2.92 |
1.3611 times |
Mon 20 October 2025 |
2.77 (0.73%) |
2.78 |
2.72 - 2.80 |
0.8378 times |
Fri 17 October 2025 |
2.75 (-0.72%) |
2.77 |
2.71 - 2.81 |
0.8231 times |
Thu 16 October 2025 |
2.77 (-1.77%) |
2.83 |
2.74 - 2.98 |
1.7566 times |
Wed 15 October 2025 |
2.82 (-0.35%) |
2.86 |
2.82 - 2.91 |
0.9992 times |
Tue 14 October 2025 |
2.83 (-1.39%) |
2.85 |
2.82 - 2.90 |
0.7541 times |
Mon 13 October 2025 |
2.87 (-2.71%) |
2.92 |
2.85 - 2.98 |
0.9972 times |
Fri 10 October 2025 |
2.95 (0.68%) |
2.93 |
2.88 - 3.00 |
1.0704 times |
Thu 09 October 2025 |
2.93 (3.17%) |
2.84 |
2.81 - 2.96 |
0.7616 times |
Wed 08 October 2025 |
2.84 (0%) |
2.84 |
2.79 - 2.88 |
0.6389 times |
Tue 07 October 2025 |
2.84 (-3.4%) |
2.93 |
2.81 - 2.93 |
0.8012 times |
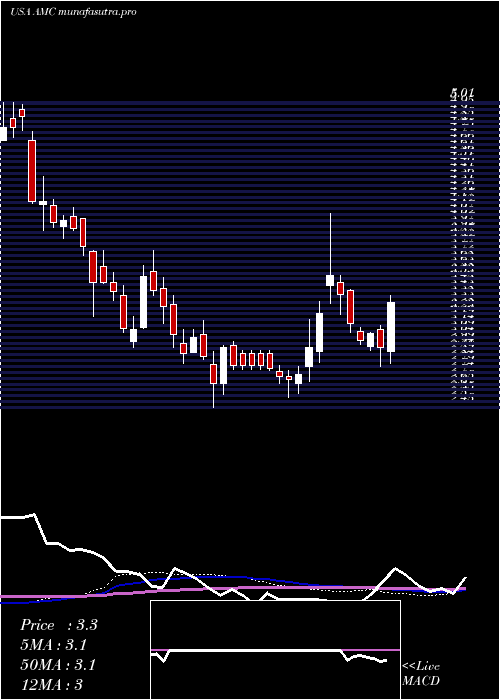
Weekly price and charts AmcEntertainment Strong weekly Stock price targets for AmcEntertainment AMC are 2.81 and 3.01 | Weekly Target 1 | 2.64 | | Weekly Target 2 | 2.77 | | Weekly Target 3 | 2.8433333333333 | | Weekly Target 4 | 2.97 | | Weekly Target 5 | 3.04 |
Weekly price and volumes for Amc Entertainment
| Date |
Closing |
Open |
Range |
Volume |
Tue 21 October 2025 |
2.89 (5.09%) |
2.78 |
2.72 - 2.92 |
0.8043 times |
Fri 17 October 2025 |
2.75 (-6.78%) |
2.92 |
2.71 - 2.98 |
1.9496 times |
Fri 10 October 2025 |
2.95 (-3.91%) |
3.06 |
2.79 - 3.12 |
1.4906 times |
Fri 03 October 2025 |
3.07 (6.23%) |
2.90 |
2.88 - 3.18 |
1.3647 times |
Fri 26 September 2025 |
2.89 (-3.99%) |
2.95 |
2.80 - 3.04 |
1.0155 times |
Fri 19 September 2025 |
3.01 (7.12%) |
2.82 |
2.80 - 3.08 |
1.4071 times |
Fri 12 September 2025 |
2.81 (2.18%) |
2.75 |
2.72 - 2.87 |
0.6689 times |
Fri 05 September 2025 |
2.75 (-2.14%) |
2.80 |
2.67 - 2.81 |
0.6273 times |
Fri 29 August 2025 |
2.81 (0%) |
2.84 |
2.80 - 2.85 |
0.1023 times |
Fri 29 August 2025 |
2.81 (-4.75%) |
2.95 |
2.80 - 2.97 |
0.5696 times |
Fri 22 August 2025 |
2.95 (-1.67%) |
3.01 |
2.81 - 3.02 |
0.5922 times |
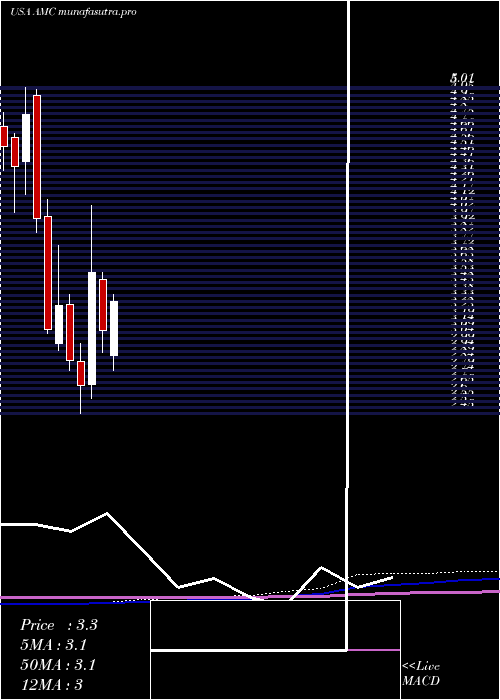
Monthly price and charts AmcEntertainment Strong monthly Stock price targets for AmcEntertainment AMC are 2.57 and 3.04 | Monthly Target 1 | 2.46 | | Monthly Target 2 | 2.67 | | Monthly Target 3 | 2.9266666666667 | | Monthly Target 4 | 3.14 | | Monthly Target 5 | 3.4 |
Monthly price and volumes Amc Entertainment
| Date |
Closing |
Open |
Range |
Volume |
Tue 21 October 2025 |
2.89 (-0.34%) |
2.91 |
2.71 - 3.18 |
1.4563 times |
Tue 30 September 2025 |
2.90 (3.2%) |
2.80 |
2.67 - 3.08 |
1.2246 times |
Fri 29 August 2025 |
2.81 (-3.1%) |
2.89 |
2.78 - 3.26 |
0.9661 times |
Thu 31 July 2025 |
2.90 (-6.45%) |
2.91 |
2.79 - 3.60 |
1.2658 times |
Mon 30 June 2025 |
3.10 (-12.92%) |
3.50 |
2.93 - 3.56 |
0.609 times |
Fri 30 May 2025 |
3.56 (33.33%) |
2.68 |
2.57 - 4.08 |
1.2703 times |
Wed 30 April 2025 |
2.67 (-6.97%) |
2.86 |
2.45 - 3.00 |
0.7006 times |
Mon 31 March 2025 |
2.87 (-13.03%) |
3.31 |
2.79 - 3.39 |
0.6284 times |
Fri 28 February 2025 |
3.30 (6.11%) |
3.00 |
2.95 - 3.77 |
0.8111 times |
Fri 31 January 2025 |
3.11 (-21.86%) |
4.00 |
3.08 - 4.13 |
1.0678 times |
Tue 31 December 2024 |
3.98 (-17.08%) |
4.95 |
3.87 - 4.99 |
0.9791 times |
DMA SMA EMA moving averages of Amc Entertainment AMC
DMA (daily moving average) of Amc Entertainment AMC
| DMA period | DMA value | | 5 day DMA | 2.8 | | 12 day DMA | 2.85 | | 20 day DMA | 2.89 | | 35 day DMA | 2.87 | | 50 day DMA | 2.88 | | 100 day DMA | 3.01 | | 150 day DMA | 2.96 | | 200 day DMA | 3.05 | EMA (exponential moving average) of Amc Entertainment AMC
| EMA period | EMA current | EMA prev | EMA prev2 | | 5 day EMA | 2.82 | 2.79 | 2.8 | | 12 day EMA | 2.85 | 2.84 | 2.85 | | 20 day EMA | 2.86 | 2.86 | 2.87 | | 35 day EMA | 2.87 | 2.87 | 2.88 | | 50 day EMA | 2.88 | 2.88 | 2.88 |
SMA (simple moving average) of Amc Entertainment AMC
| SMA period | SMA current | SMA prev | SMA prev2 | | 5 day SMA | 2.8 | 2.79 | 2.81 | | 12 day SMA | 2.85 | 2.87 | 2.89 | | 20 day SMA | 2.89 | 2.9 | 2.91 | | 35 day SMA | 2.87 | 2.87 | 2.87 | | 50 day SMA | 2.88 | 2.88 | 2.88 | | 100 day SMA | 3.01 | 3.01 | 3.03 | | 150 day SMA | 2.96 | 2.96 | 2.96 | | 200 day SMA | 3.05 | 3.05 | 3.06 |
|
|
