AmbarellaInc AMBA full analysis,charts,indicators,moving averages,SMA,DMA,EMA,ADX,MACD,RSIAmbarella Inc AMBA WideScreen charts, DMA,SMA,EMA technical analysis, forecast prediction, by indicators ADX,MACD,RSI,CCI USA stock exchange
operates under Technology sector & deals in Semiconductors
Daily price and charts and targets AmbarellaInc Strong Daily Stock price targets for AmbarellaInc AMBA are 70.18 and 72.37 | Daily Target 1 | 68.42 | | Daily Target 2 | 69.74 | | Daily Target 3 | 70.61 | | Daily Target 4 | 71.93 | | Daily Target 5 | 72.8 |
Daily price and volume Ambarella Inc
| Date |
Closing |
Open |
Range |
Volume |
Thu 04 December 2025 |
71.06 (1.36%) |
70.00 |
69.29 - 71.48 |
0.7371 times |
Wed 03 December 2025 |
70.11 (-1.38%) |
71.65 |
68.79 - 71.65 |
1.1863 times |
Tue 02 December 2025 |
71.09 (0.24%) |
72.00 |
70.70 - 73.46 |
1.3054 times |
Mon 01 December 2025 |
70.92 (-4.39%) |
72.50 |
69.80 - 73.29 |
0.9599 times |
Fri 28 November 2025 |
74.18 (0.45%) |
75.01 |
72.77 - 75.23 |
0.694 times |
Wed 26 November 2025 |
73.85 (-18.78%) |
85.00 |
73.68 - 85.50 |
2.0948 times |
Tue 25 November 2025 |
90.93 (1.52%) |
89.48 |
84.70 - 91.18 |
0.6667 times |
Mon 24 November 2025 |
89.57 (3.98%) |
86.11 |
85.45 - 90.67 |
0.8416 times |
Fri 21 November 2025 |
86.14 (3.38%) |
83.51 |
80.31 - 87.29 |
0.7136 times |
Thu 20 November 2025 |
83.32 (-4.71%) |
90.62 |
83.17 - 92.79 |
0.8007 times |
Wed 19 November 2025 |
87.44 (5.24%) |
85.00 |
83.09 - 89.14 |
0.647 times |
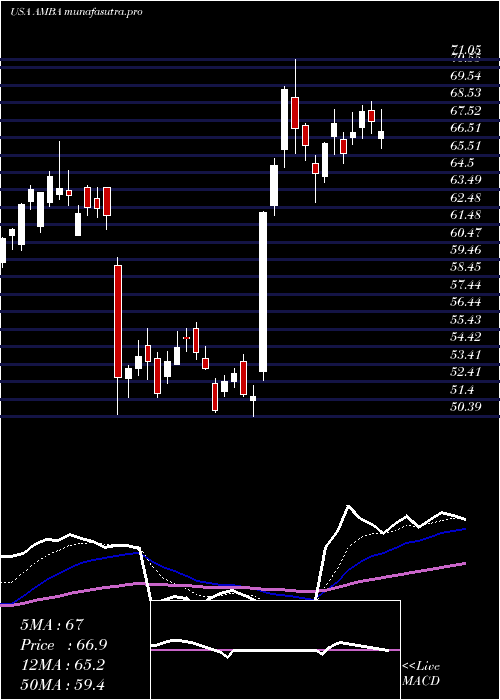
Weekly price and charts AmbarellaInc Strong weekly Stock price targets for AmbarellaInc AMBA are 67.59 and 72.26 | Weekly Target 1 | 66.43 | | Weekly Target 2 | 68.75 | | Weekly Target 3 | 71.103333333333 | | Weekly Target 4 | 73.42 | | Weekly Target 5 | 75.77 |
Weekly price and volumes for Ambarella Inc
| Date |
Closing |
Open |
Range |
Volume |
Thu 04 December 2025 |
71.06 (-4.21%) |
72.50 |
68.79 - 73.46 |
1.7846 times |
Fri 28 November 2025 |
74.18 (-13.88%) |
86.11 |
72.77 - 91.18 |
1.8308 times |
Fri 21 November 2025 |
86.14 (-1.94%) |
86.22 |
80.31 - 92.79 |
1.354 times |
Fri 14 November 2025 |
87.84 (-2.04%) |
92.34 |
85.50 - 96.69 |
1.1855 times |
Fri 07 November 2025 |
89.67 (5.21%) |
81.89 |
81.26 - 94.79 |
0.9316 times |
Fri 31 October 2025 |
85.23 (0%) |
85.78 |
84.31 - 87.38 |
0.1012 times |
Fri 31 October 2025 |
85.23 (-0.47%) |
87.35 |
83.57 - 88.34 |
0.5833 times |
Fri 24 October 2025 |
85.63 (3.57%) |
83.12 |
78.31 - 86.50 |
0.4681 times |
Fri 17 October 2025 |
82.68 (13.45%) |
76.21 |
76.13 - 88.49 |
0.8373 times |
Fri 10 October 2025 |
72.88 (-13.4%) |
85.98 |
72.58 - 87.10 |
0.9236 times |
Fri 03 October 2025 |
84.16 (1.06%) |
84.06 |
81.16 - 87.49 |
0.7021 times |
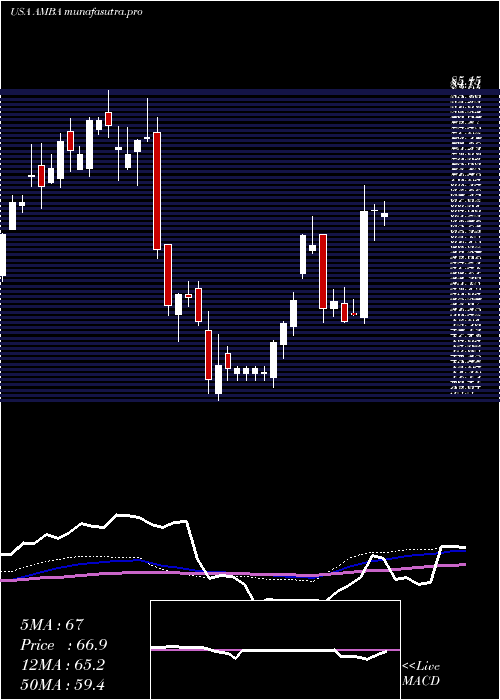
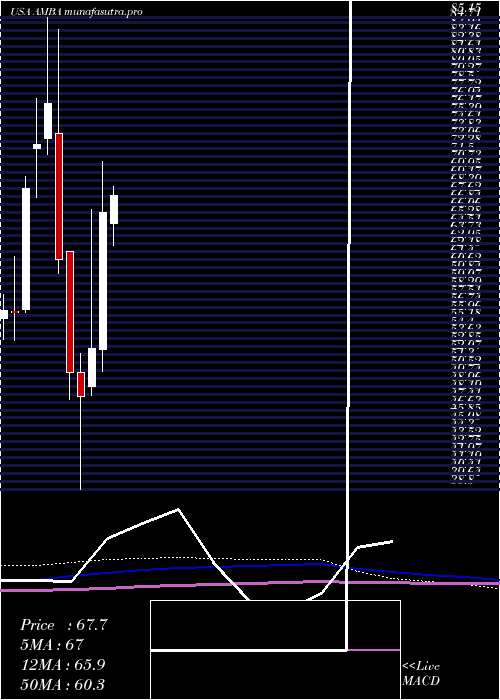
Monthly price and charts AmbarellaInc Strong monthly Stock price targets for AmbarellaInc AMBA are 67.59 and 72.26 | Monthly Target 1 | 66.43 | | Monthly Target 2 | 68.75 | | Monthly Target 3 | 71.103333333333 | | Monthly Target 4 | 73.42 | | Monthly Target 5 | 75.77 |
Monthly price and volumes Ambarella Inc
| Date |
Closing |
Open |
Range |
Volume |
Thu 04 December 2025 |
71.06 (-4.21%) |
72.50 |
68.79 - 73.46 |
0.3418 times |
Fri 28 November 2025 |
74.18 (-12.96%) |
81.89 |
72.77 - 96.69 |
1.0156 times |
Fri 31 October 2025 |
85.23 (3.28%) |
81.16 |
72.58 - 88.49 |
0.6381 times |
Tue 30 September 2025 |
82.52 (0.05%) |
79.53 |
75.57 - 89.29 |
1.0652 times |
Fri 29 August 2025 |
82.48 (24.8%) |
64.00 |
61.31 - 93.44 |
1.5666 times |
Thu 31 July 2025 |
66.09 (0.03%) |
65.00 |
62.77 - 71.94 |
0.7687 times |
Mon 30 June 2025 |
66.07 (25.51%) |
52.60 |
50.39 - 71.05 |
1.5617 times |
Fri 30 May 2025 |
52.64 (9.69%) |
48.95 |
48.09 - 66.31 |
1.0608 times |
Wed 30 April 2025 |
47.99 (-4.65%) |
50.35 |
38.86 - 52.22 |
0.9417 times |
Mon 31 March 2025 |
50.33 (-18.07%) |
62.19 |
47.62 - 62.21 |
1.0397 times |
Fri 28 February 2025 |
61.43 (-19.93%) |
73.78 |
60.05 - 84.00 |
1.0732 times |
DMA SMA EMA moving averages of Ambarella Inc AMBA
DMA (daily moving average) of Ambarella Inc AMBA
| DMA period | DMA value | | 5 day DMA | 71.47 | | 12 day DMA | 79.31 | | 20 day DMA | 83.81 | | 35 day DMA | 84.05 | | 50 day DMA | 83.68 | | 100 day DMA | 78.52 | | 150 day DMA | 72.05 | | 200 day DMA | 67.19 | EMA (exponential moving average) of Ambarella Inc AMBA
| EMA period | EMA current | EMA prev | EMA prev2 | | 5 day EMA | 72.69 | 73.5 | 75.2 | | 12 day EMA | 77.5 | 78.67 | 80.22 | | 20 day EMA | 80.28 | 81.25 | 82.42 | | 35 day EMA | 82.17 | 82.82 | 83.57 | | 50 day EMA | 82.57 | 83.04 | 83.57 |
SMA (simple moving average) of Ambarella Inc AMBA
| SMA period | SMA current | SMA prev | SMA prev2 | | 5 day SMA | 71.47 | 72.03 | 76.19 | | 12 day SMA | 79.31 | 80.39 | 81.87 | | 20 day SMA | 83.81 | 84.58 | 85.18 | | 35 day SMA | 84.05 | 84.4 | 84.71 | | 50 day SMA | 83.68 | 83.95 | 84.29 | | 100 day SMA | 78.52 | 78.48 | 78.44 | | 150 day SMA | 72.05 | 71.9 | 71.74 | | 200 day SMA | 67.19 | 67.25 | 67.29 |
|
|
