AutolivInc ALV full analysis,charts,indicators,moving averages,SMA,DMA,EMA,ADX,MACD,RSIAutoliv Inc ALV WideScreen charts, DMA,SMA,EMA technical analysis, forecast prediction, by indicators ADX,MACD,RSI,CCI USA stock exchange
operates under Capital Goods sector & deals in Auto Parts O E M
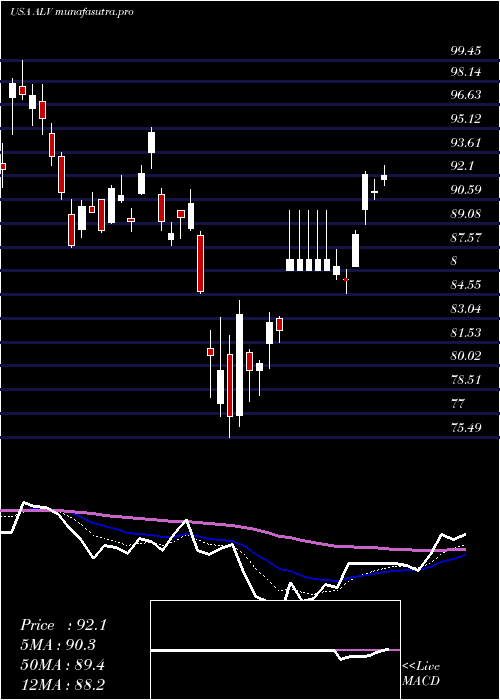
Daily price and charts and targets AutolivInc Strong Daily Stock price targets for AutolivInc ALV are 116.82 and 119.34 | Daily Target 1 | 116.33 | | Daily Target 2 | 117.3 | | Daily Target 3 | 118.84666666667 | | Daily Target 4 | 119.82 | | Daily Target 5 | 121.37 |
Daily price and volume Autoliv Inc
| Date |
Closing |
Open |
Range |
Volume |
Thu 04 December 2025 |
118.28 (-1.25%) |
119.86 |
117.87 - 120.39 |
0.7245 times |
Wed 03 December 2025 |
119.78 (1.6%) |
118.82 |
118.43 - 121.45 |
1.0565 times |
Tue 02 December 2025 |
117.89 (-0.58%) |
118.93 |
116.55 - 119.00 |
0.814 times |
Mon 01 December 2025 |
118.58 (0.5%) |
118.27 |
117.54 - 118.71 |
1.0831 times |
Fri 28 November 2025 |
117.99 (-0.23%) |
118.88 |
117.50 - 119.48 |
0.7299 times |
Wed 26 November 2025 |
118.26 (0.76%) |
118.47 |
117.18 - 119.74 |
1.054 times |
Tue 25 November 2025 |
117.37 (2.03%) |
115.52 |
115.49 - 117.78 |
0.5759 times |
Mon 24 November 2025 |
115.03 (-1.41%) |
116.61 |
114.93 - 116.94 |
1.4103 times |
Fri 21 November 2025 |
116.67 (3.53%) |
112.83 |
112.49 - 116.86 |
1.1521 times |
Thu 20 November 2025 |
112.69 (-3.39%) |
117.04 |
112.58 - 117.25 |
1.3997 times |
Wed 19 November 2025 |
116.65 (-0.6%) |
117.67 |
116.15 - 117.76 |
0.8846 times |
Weekly price and charts AutolivInc Strong weekly Stock price targets for AutolivInc ALV are 117.42 and 122.32 | Weekly Target 1 | 113.86 | | Weekly Target 2 | 116.07 | | Weekly Target 3 | 118.76 | | Weekly Target 4 | 120.97 | | Weekly Target 5 | 123.66 |
Weekly price and volumes for Autoliv Inc
| Date |
Closing |
Open |
Range |
Volume |
Thu 04 December 2025 |
118.28 (0.25%) |
118.27 |
116.55 - 121.45 |
0.7868 times |
Fri 28 November 2025 |
117.99 (1.13%) |
116.61 |
114.93 - 119.74 |
0.8065 times |
Fri 21 November 2025 |
116.67 (-3.39%) |
119.80 |
112.49 - 120.18 |
1.0877 times |
Fri 14 November 2025 |
120.76 (-0.82%) |
122.39 |
119.33 - 125.44 |
0.8867 times |
Fri 07 November 2025 |
121.76 (4.25%) |
118.45 |
118.05 - 122.07 |
0.7816 times |
Fri 31 October 2025 |
116.80 (0%) |
116.12 |
115.00 - 117.00 |
0.1964 times |
Fri 31 October 2025 |
116.80 (0.96%) |
116.27 |
114.50 - 118.76 |
1.1079 times |
Fri 24 October 2025 |
115.69 (-1.93%) |
117.97 |
115.26 - 119.68 |
1.5773 times |
Fri 17 October 2025 |
117.97 (2.06%) |
117.95 |
115.01 - 122.00 |
1.6613 times |
Fri 10 October 2025 |
115.59 (-9.7%) |
128.54 |
115.42 - 129.87 |
1.1079 times |
Fri 03 October 2025 |
128.01 (2.25%) |
125.95 |
122.46 - 128.03 |
0.9518 times |
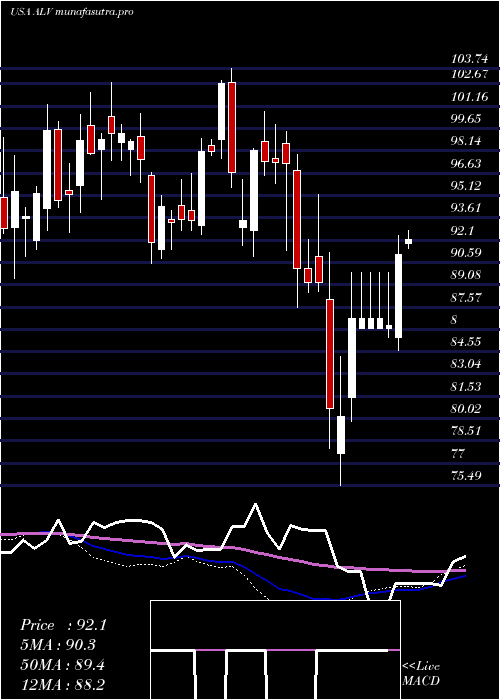
Monthly price and charts AutolivInc Strong monthly Stock price targets for AutolivInc ALV are 117.42 and 122.32 | Monthly Target 1 | 113.86 | | Monthly Target 2 | 116.07 | | Monthly Target 3 | 118.76 | | Monthly Target 4 | 120.97 | | Monthly Target 5 | 123.66 |
Monthly price and volumes Autoliv Inc
| Date |
Closing |
Open |
Range |
Volume |
Thu 04 December 2025 |
118.28 (0.25%) |
118.27 |
116.55 - 121.45 |
0.1526 times |
Fri 28 November 2025 |
117.99 (1.02%) |
118.45 |
112.49 - 125.44 |
0.691 times |
Fri 31 October 2025 |
116.80 (-5.43%) |
124.44 |
114.50 - 129.87 |
1.2027 times |
Tue 30 September 2025 |
123.50 (-0.46%) |
122.31 |
122.02 - 127.89 |
0.8388 times |
Fri 29 August 2025 |
124.07 (11.22%) |
111.14 |
109.40 - 125.82 |
0.8446 times |
Thu 31 July 2025 |
111.55 (-0.31%) |
111.55 |
110.51 - 118.98 |
1.3905 times |
Mon 30 June 2025 |
111.90 (8.83%) |
102.04 |
100.75 - 113.20 |
1.082 times |
Fri 30 May 2025 |
102.82 (10.29%) |
93.72 |
92.48 - 105.60 |
0.81 times |
Wed 30 April 2025 |
93.23 (5.4%) |
89.89 |
75.49 - 93.51 |
1.4082 times |
Mon 31 March 2025 |
88.45 (-9.14%) |
98.63 |
87.55 - 99.45 |
1.5797 times |
Fri 28 February 2025 |
97.35 (0.71%) |
92.95 |
90.97 - 100.77 |
1.1158 times |

DMA SMA EMA moving averages of Autoliv Inc ALV
DMA (daily moving average) of Autoliv Inc ALV
| DMA period | DMA value | | 5 day DMA | 118.5 | | 12 day DMA | 117.21 | | 20 day DMA | 118.95 | | 35 day DMA | 118.34 | | 50 day DMA | 119.61 | | 100 day DMA | 119.88 | | 150 day DMA | 115.37 | | 200 day DMA | 109.06 | EMA (exponential moving average) of Autoliv Inc ALV
| EMA period | EMA current | EMA prev | EMA prev2 | | 5 day EMA | 118.41 | 118.47 | 117.82 | | 12 day EMA | 118.19 | 118.17 | 117.88 | | 20 day EMA | 118.42 | 118.44 | 118.3 | | 35 day EMA | 119.28 | 119.34 | 119.31 | | 50 day EMA | 120.03 | 120.1 | 120.11 |
SMA (simple moving average) of Autoliv Inc ALV
| SMA period | SMA current | SMA prev | SMA prev2 | | 5 day SMA | 118.5 | 118.5 | 118.02 | | 12 day SMA | 117.21 | 117.12 | 117.2 | | 20 day SMA | 118.95 | 119.1 | 119.1 | | 35 day SMA | 118.34 | 118.42 | 118.39 | | 50 day SMA | 119.61 | 119.74 | 119.88 | | 100 day SMA | 119.88 | 119.85 | 119.83 | | 150 day SMA | 115.37 | 115.21 | 115.03 | | 200 day SMA | 109.06 | 108.96 | 108.86 |
|
|
