AlnylamPharmaceuticals ALNY full analysis,charts,indicators,moving averages,SMA,DMA,EMA,ADX,MACD,RSIAlnylam Pharmaceuticals ALNY WideScreen charts, DMA,SMA,EMA technical analysis, forecast prediction, by indicators ADX,MACD,RSI,CCI USA stock exchange
operates under Health Care sector & deals in Major Pharmaceuticals
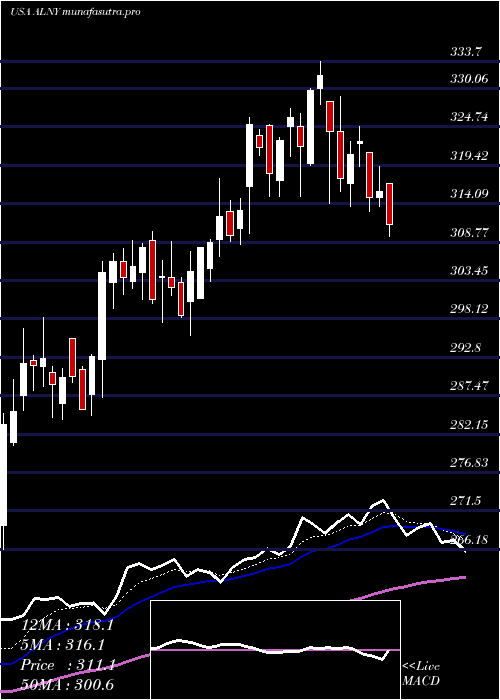
Daily price and charts and targets AlnylamPharmaceuticals Strong Daily Stock price targets for AlnylamPharmaceuticals ALNY are 457.17 and 471.2 | Daily Target 1 | 454.45 | | Daily Target 2 | 459.89 | | Daily Target 3 | 468.47666666667 | | Daily Target 4 | 473.92 | | Daily Target 5 | 482.51 |
Daily price and volume Alnylam Pharmaceuticals
| Date |
Closing |
Open |
Range |
Volume |
Thu 04 December 2025 |
465.34 (-1.68%) |
472.67 |
463.03 - 477.06 |
0.9222 times |
Wed 03 December 2025 |
473.29 (1.8%) |
466.48 |
460.41 - 479.79 |
1.0244 times |
Tue 02 December 2025 |
464.93 (2.28%) |
453.90 |
453.01 - 472.48 |
1.1286 times |
Mon 01 December 2025 |
454.56 (0.74%) |
450.00 |
448.27 - 462.93 |
1.0035 times |
Fri 28 November 2025 |
451.23 (1.37%) |
448.18 |
444.43 - 455.76 |
0.5285 times |
Wed 26 November 2025 |
445.12 (3.56%) |
432.87 |
430.27 - 447.69 |
0.8512 times |
Tue 25 November 2025 |
429.80 (-1.02%) |
436.84 |
428.57 - 441.82 |
0.946 times |
Mon 24 November 2025 |
434.23 (-0.49%) |
439.46 |
420.30 - 444.67 |
1.6406 times |
Fri 21 November 2025 |
436.38 (-2.11%) |
448.23 |
433.50 - 449.53 |
1.2167 times |
Thu 20 November 2025 |
445.79 (-3.25%) |
463.32 |
445.34 - 467.73 |
0.7382 times |
Wed 19 November 2025 |
460.76 (-0.33%) |
462.27 |
456.90 - 465.32 |
0.8378 times |
Weekly price and charts AlnylamPharmaceuticals Strong weekly Stock price targets for AlnylamPharmaceuticals ALNY are 456.81 and 488.33 | Weekly Target 1 | 432.95 | | Weekly Target 2 | 449.14 | | Weekly Target 3 | 464.46666666667 | | Weekly Target 4 | 480.66 | | Weekly Target 5 | 495.99 |
Weekly price and volumes for Alnylam Pharmaceuticals
| Date |
Closing |
Open |
Range |
Volume |
Thu 04 December 2025 |
465.34 (3.13%) |
450.00 |
448.27 - 479.79 |
0.948 times |
Fri 28 November 2025 |
451.23 (3.4%) |
439.46 |
420.30 - 455.76 |
0.9219 times |
Fri 21 November 2025 |
436.38 (-2.85%) |
449.00 |
433.50 - 469.11 |
1.0044 times |
Fri 14 November 2025 |
449.16 (1.46%) |
445.00 |
440.93 - 461.96 |
0.9642 times |
Fri 07 November 2025 |
442.70 (-2.93%) |
429.90 |
417.00 - 445.50 |
0.7991 times |
Fri 31 October 2025 |
456.04 (0%) |
449.00 |
441.22 - 459.77 |
0.396 times |
Fri 31 October 2025 |
456.04 (-1.59%) |
465.56 |
436.51 - 485.36 |
1.6345 times |
Fri 24 October 2025 |
463.43 (-3.79%) |
476.82 |
456.90 - 495.55 |
0.9108 times |
Fri 17 October 2025 |
481.67 (4.61%) |
456.13 |
453.83 - 492.62 |
1.4127 times |
Fri 10 October 2025 |
460.46 (0.9%) |
458.69 |
448.83 - 464.46 |
1.0085 times |
Fri 03 October 2025 |
456.35 (2.23%) |
448.00 |
445.22 - 467.42 |
1.1445 times |
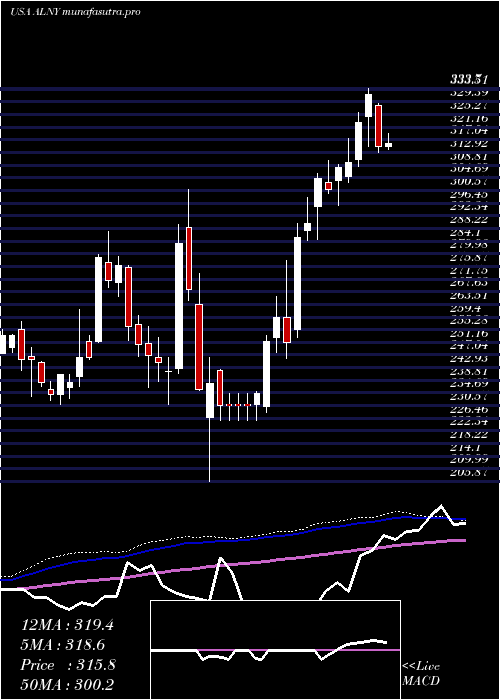
Monthly price and charts AlnylamPharmaceuticals Strong monthly Stock price targets for AlnylamPharmaceuticals ALNY are 456.81 and 488.33 | Monthly Target 1 | 432.95 | | Monthly Target 2 | 449.14 | | Monthly Target 3 | 464.46666666667 | | Monthly Target 4 | 480.66 | | Monthly Target 5 | 495.99 |
Monthly price and volumes Alnylam Pharmaceuticals
| Date |
Closing |
Open |
Range |
Volume |
Thu 04 December 2025 |
465.34 (3.13%) |
450.00 |
448.27 - 479.79 |
0.2215 times |
Fri 28 November 2025 |
451.23 (-1.05%) |
429.90 |
417.00 - 469.11 |
0.8622 times |
Fri 31 October 2025 |
456.04 (0.01%) |
456.00 |
436.51 - 495.55 |
1.4137 times |
Tue 30 September 2025 |
456.00 (2.13%) |
445.84 |
441.50 - 484.21 |
1.2171 times |
Fri 29 August 2025 |
446.51 (13.84%) |
388.68 |
382.19 - 469.81 |
1.2712 times |
Thu 31 July 2025 |
392.24 (20.29%) |
324.77 |
309.57 - 402.43 |
1.1818 times |
Mon 30 June 2025 |
326.09 (7.07%) |
303.10 |
295.82 - 327.21 |
0.8191 times |
Fri 30 May 2025 |
304.56 (15.7%) |
257.14 |
245.96 - 306.00 |
1.1652 times |
Wed 30 April 2025 |
263.24 (-2.51%) |
272.52 |
205.87 - 273.61 |
1.0625 times |
Mon 31 March 2025 |
270.02 (9.43%) |
246.18 |
230.79 - 300.90 |
0.7857 times |
Fri 28 February 2025 |
246.75 (-9.05%) |
270.78 |
236.50 - 279.24 |
0.7527 times |
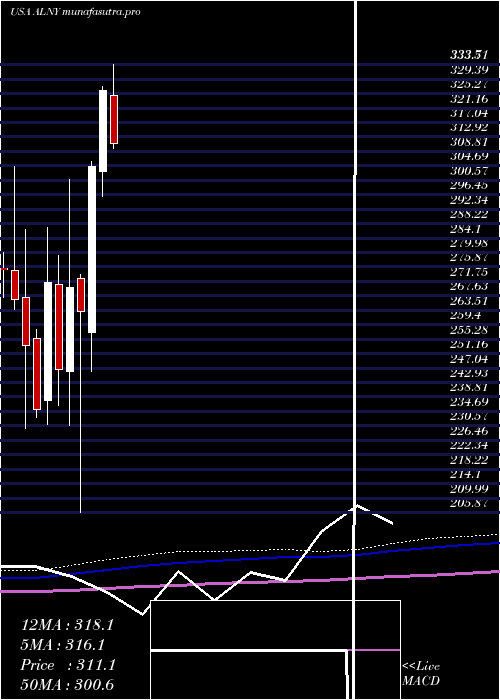
DMA SMA EMA moving averages of Alnylam Pharmaceuticals ALNY
DMA (daily moving average) of Alnylam Pharmaceuticals ALNY
| DMA period | DMA value | | 5 day DMA | 461.87 | | 12 day DMA | 451.98 | | 20 day DMA | 450.85 | | 35 day DMA | 456.94 | | 50 day DMA | 457.09 | | 100 day DMA | 439.33 | | 150 day DMA | 392.59 | | 200 day DMA | 355.93 | EMA (exponential moving average) of Alnylam Pharmaceuticals ALNY
| EMA period | EMA current | EMA prev | EMA prev2 | | 5 day EMA | 461.84 | 460.09 | 453.49 | | 12 day EMA | 455.57 | 453.79 | 450.24 | | 20 day EMA | 454.17 | 453 | 450.86 | | 35 day EMA | 454.88 | 454.26 | 453.14 | | 50 day EMA | 457.5 | 457.18 | 456.52 |
SMA (simple moving average) of Alnylam Pharmaceuticals ALNY
| SMA period | SMA current | SMA prev | SMA prev2 | | 5 day SMA | 461.87 | 457.83 | 449.13 | | 12 day SMA | 451.98 | 451.58 | 449.57 | | 20 day SMA | 450.85 | 449.31 | 446.82 | | 35 day SMA | 456.94 | 457.08 | 456.97 | | 50 day SMA | 457.09 | 456.96 | 456.58 | | 100 day SMA | 439.33 | 437.78 | 436.21 | | 150 day SMA | 392.59 | 391.24 | 389.8 | | 200 day SMA | 355.93 | 354.86 | 353.77 |
|
|
