AkebiaTherapeutics AKBA full analysis,charts,indicators,moving averages,SMA,DMA,EMA,ADX,MACD,RSIAkebia Therapeutics AKBA WideScreen charts, DMA,SMA,EMA technical analysis, forecast prediction, by indicators ADX,MACD,RSI,CCI USA stock exchange
operates under Health Care sector & deals in Major Pharmaceuticals
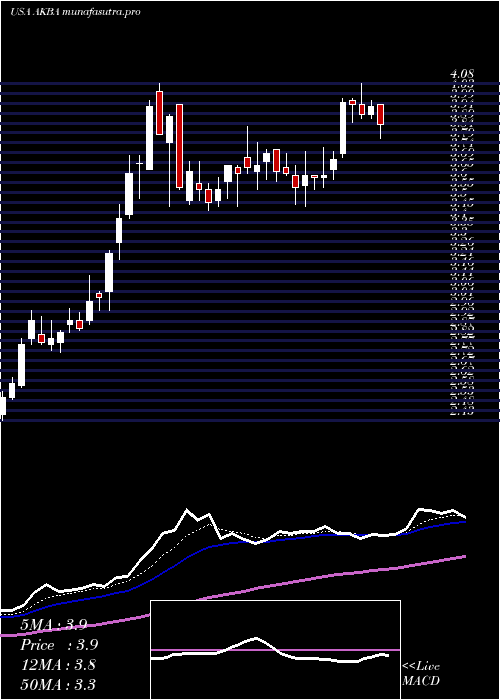
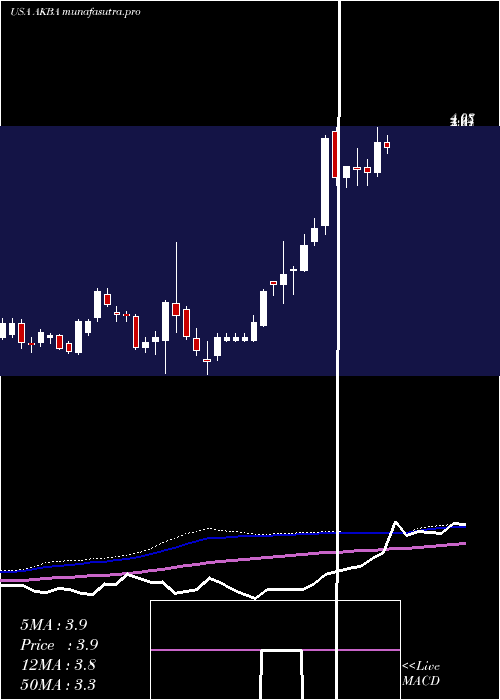
Daily price and charts and targets AkebiaTherapeutics Strong Daily Stock price targets for AkebiaTherapeutics AKBA are 3.04 and 3.31 | Daily Target 1 | 2.82 | | Daily Target 2 | 2.99 | | Daily Target 3 | 3.0866666666667 | | Daily Target 4 | 3.26 | | Daily Target 5 | 3.36 |
Daily price and volume Akebia Therapeutics
| Date |
Closing |
Open |
Range |
Volume |
Mon 20 October 2025 |
3.17 (8.19%) |
2.96 |
2.91 - 3.18 |
1.0304 times |
Fri 17 October 2025 |
2.93 (0.34%) |
2.90 |
2.87 - 2.96 |
0.7914 times |
Thu 16 October 2025 |
2.92 (-1.02%) |
2.97 |
2.89 - 3.10 |
1.2058 times |
Wed 15 October 2025 |
2.95 (5.73%) |
2.79 |
2.79 - 2.97 |
1.1432 times |
Tue 14 October 2025 |
2.79 (0.36%) |
2.75 |
2.70 - 2.84 |
0.6394 times |
Mon 13 October 2025 |
2.78 (1.09%) |
2.77 |
2.69 - 2.81 |
0.929 times |
Fri 10 October 2025 |
2.75 (-4.84%) |
2.89 |
2.75 - 2.91 |
1.1298 times |
Thu 09 October 2025 |
2.89 (1.4%) |
2.85 |
2.85 - 2.97 |
0.8159 times |
Wed 08 October 2025 |
2.85 (-3.39%) |
2.99 |
2.83 - 3.02 |
0.9967 times |
Tue 07 October 2025 |
2.95 (-1.34%) |
2.99 |
2.88 - 2.99 |
1.3184 times |
Mon 06 October 2025 |
2.99 (6.03%) |
2.85 |
2.81 - 3.01 |
1.5378 times |
Weekly price and charts AkebiaTherapeutics Strong weekly Stock price targets for AkebiaTherapeutics AKBA are 3.04 and 3.31 | Weekly Target 1 | 2.82 | | Weekly Target 2 | 2.99 | | Weekly Target 3 | 3.0866666666667 | | Weekly Target 4 | 3.26 | | Weekly Target 5 | 3.36 |
Weekly price and volumes for Akebia Therapeutics
| Date |
Closing |
Open |
Range |
Volume |
Mon 20 October 2025 |
3.17 (8.19%) |
2.96 |
2.91 - 3.18 |
0.1998 times |
Fri 17 October 2025 |
2.93 (6.55%) |
2.77 |
2.69 - 3.10 |
0.913 times |
Fri 10 October 2025 |
2.75 (-2.48%) |
2.85 |
2.75 - 3.02 |
1.1243 times |
Fri 03 October 2025 |
2.82 (2.92%) |
2.75 |
2.66 - 2.92 |
0.8288 times |
Fri 26 September 2025 |
2.74 (-2.84%) |
2.78 |
2.68 - 2.90 |
0.7937 times |
Fri 19 September 2025 |
2.82 (-4.41%) |
2.97 |
2.80 - 3.02 |
1.7377 times |
Fri 12 September 2025 |
2.95 (-0.34%) |
2.97 |
2.91 - 3.15 |
1.2387 times |
Fri 05 September 2025 |
2.96 (-5.73%) |
3.07 |
2.90 - 3.22 |
1.4801 times |
Fri 29 August 2025 |
3.14 (0%) |
3.12 |
3.03 - 3.15 |
0.1884 times |
Fri 29 August 2025 |
3.14 (-1.57%) |
3.19 |
2.98 - 3.21 |
1.4955 times |
Fri 22 August 2025 |
3.19 (-1.85%) |
3.21 |
3.02 - 3.32 |
1.3964 times |
Monthly price and charts AkebiaTherapeutics Strong monthly Stock price targets for AkebiaTherapeutics AKBA are 2.92 and 3.44 | Monthly Target 1 | 2.48 | | Monthly Target 2 | 2.83 | | Monthly Target 3 | 3.0033333333333 | | Monthly Target 4 | 3.35 | | Monthly Target 5 | 3.52 |
Monthly price and volumes Akebia Therapeutics
| Date |
Closing |
Open |
Range |
Volume |
Mon 20 October 2025 |
3.17 (16.12%) |
2.72 |
2.66 - 3.18 |
0.4713 times |
Tue 30 September 2025 |
2.73 (-13.06%) |
3.07 |
2.66 - 3.22 |
0.9441 times |
Fri 29 August 2025 |
3.14 (-14.91%) |
3.65 |
2.92 - 3.79 |
1.1281 times |
Thu 31 July 2025 |
3.69 (1.37%) |
3.63 |
3.47 - 4.08 |
0.9096 times |
Mon 30 June 2025 |
3.64 (20.13%) |
3.06 |
2.97 - 4.08 |
1.5889 times |
Fri 30 May 2025 |
3.03 (25.73%) |
2.41 |
2.25 - 3.14 |
1.2971 times |
Wed 30 April 2025 |
2.41 (25.52%) |
1.99 |
1.52 - 2.48 |
1.047 times |
Mon 31 March 2025 |
1.92 (3.78%) |
1.86 |
1.53 - 2.89 |
1.3893 times |
Fri 28 February 2025 |
1.85 (-17.41%) |
2.16 |
1.74 - 2.22 |
0.4889 times |
Fri 31 January 2025 |
2.24 (17.89%) |
1.90 |
1.72 - 2.41 |
0.7357 times |
Tue 31 December 2024 |
1.90 (-7.32%) |
2.05 |
1.74 - 2.09 |
0.4165 times |
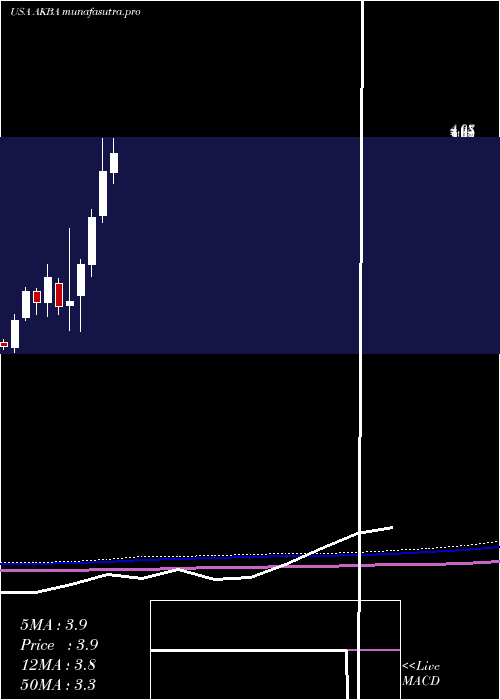
DMA SMA EMA moving averages of Akebia Therapeutics AKBA
DMA (daily moving average) of Akebia Therapeutics AKBA
| DMA period | DMA value | | 5 day DMA | 2.95 | | 12 day DMA | 2.9 | | 20 day DMA | 2.83 | | 35 day DMA | 2.89 | | 50 day DMA | 2.97 | | 100 day DMA | 3.31 | | 150 day DMA | 2.95 | | 200 day DMA | 2.72 | EMA (exponential moving average) of Akebia Therapeutics AKBA
| EMA period | EMA current | EMA prev | EMA prev2 | | 5 day EMA | 2.98 | 2.89 | 2.87 | | 12 day EMA | 2.91 | 2.86 | 2.85 | | 20 day EMA | 2.9 | 2.87 | 2.86 | | 35 day EMA | 2.92 | 2.91 | 2.91 | | 50 day EMA | 3.02 | 3.01 | 3.01 |
SMA (simple moving average) of Akebia Therapeutics AKBA
| SMA period | SMA current | SMA prev | SMA prev2 | | 5 day SMA | 2.95 | 2.87 | 2.84 | | 12 day SMA | 2.9 | 2.86 | 2.84 | | 20 day SMA | 2.83 | 2.82 | 2.81 | | 35 day SMA | 2.89 | 2.89 | 2.89 | | 50 day SMA | 2.97 | 2.97 | 2.98 | | 100 day SMA | 3.31 | 3.3 | 3.3 | | 150 day SMA | 2.95 | 2.94 | 2.94 | | 200 day SMA | 2.72 | 2.71 | 2.71 |
|
|
