AppliedIndustrial AIT full analysis,charts,indicators,moving averages,SMA,DMA,EMA,ADX,MACD,RSIApplied Industrial AIT WideScreen charts, DMA,SMA,EMA technical analysis, forecast prediction, by indicators ADX,MACD,RSI,CCI USA stock exchange
operates under Consumer Durables sector & deals in Industrial Specialties
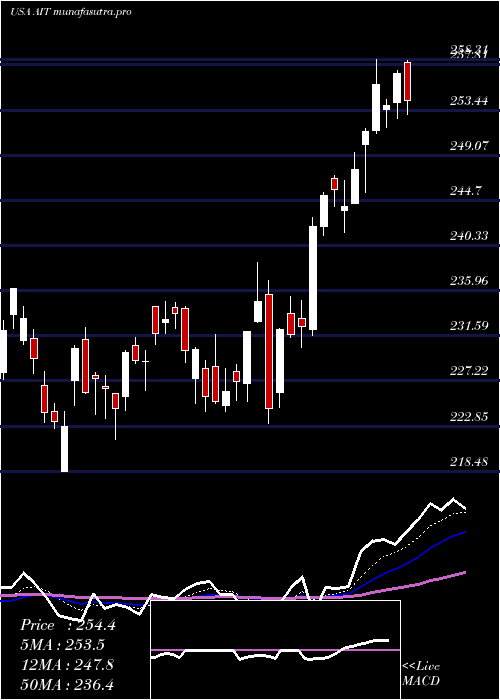
Daily price and charts and targets AppliedIndustrial Strong Daily Stock price targets for AppliedIndustrial AIT are 254.99 and 258.81 | Daily Target 1 | 254.01 | | Daily Target 2 | 255.96 | | Daily Target 3 | 257.83 | | Daily Target 4 | 259.78 | | Daily Target 5 | 261.65 |
Daily price and volume Applied Industrial
| Date |
Closing |
Open |
Range |
Volume |
Fri 05 December 2025 |
257.91 (-0.36%) |
258.85 |
255.88 - 259.70 |
0.9194 times |
Thu 04 December 2025 |
258.83 (-0.79%) |
260.67 |
258.65 - 262.92 |
1.0819 times |
Wed 03 December 2025 |
260.88 (1.38%) |
257.71 |
256.23 - 260.95 |
1.0985 times |
Tue 02 December 2025 |
257.32 (0.34%) |
257.61 |
254.70 - 259.72 |
0.7689 times |
Mon 01 December 2025 |
256.44 (-0.92%) |
256.62 |
255.77 - 260.17 |
0.9567 times |
Fri 28 November 2025 |
258.82 (0.58%) |
258.44 |
256.68 - 259.56 |
0.5459 times |
Wed 26 November 2025 |
257.32 (0.6%) |
255.22 |
255.22 - 259.33 |
0.9994 times |
Tue 25 November 2025 |
255.78 (2.7%) |
250.55 |
249.39 - 256.35 |
1.1714 times |
Mon 24 November 2025 |
249.05 (0.05%) |
248.27 |
244.23 - 252.61 |
1.1781 times |
Fri 21 November 2025 |
248.92 (2.64%) |
243.52 |
243.02 - 252.38 |
1.2796 times |
Thu 20 November 2025 |
242.52 (-0.52%) |
248.08 |
242.48 - 253.63 |
1.1797 times |
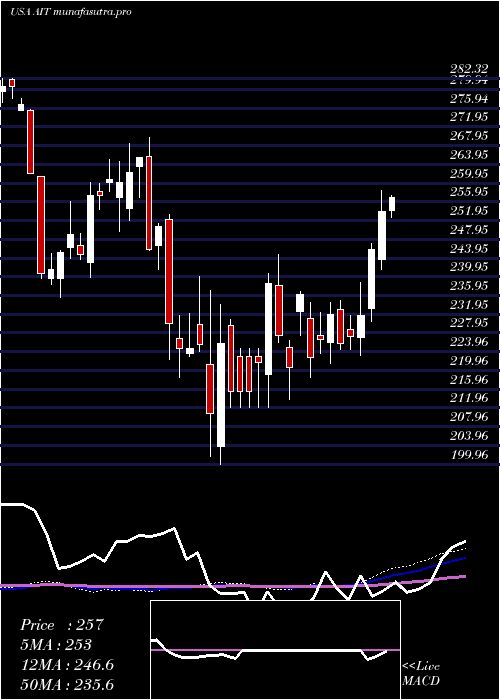
Weekly price and charts AppliedIndustrial Strong weekly Stock price targets for AppliedIndustrial AIT are 256.31 and 264.53 | Weekly Target 1 | 250.29 | | Weekly Target 2 | 254.1 | | Weekly Target 3 | 258.51 | | Weekly Target 4 | 262.32 | | Weekly Target 5 | 266.73 |
Weekly price and volumes for Applied Industrial
| Date |
Closing |
Open |
Range |
Volume |
Fri 05 December 2025 |
257.91 (-0.35%) |
256.62 |
254.70 - 262.92 |
0.9753 times |
Fri 28 November 2025 |
258.82 (3.98%) |
248.27 |
244.23 - 259.56 |
0.7873 times |
Fri 21 November 2025 |
248.92 (-0.02%) |
249.02 |
238.72 - 253.63 |
1.1254 times |
Fri 14 November 2025 |
248.96 (-3.85%) |
259.74 |
245.39 - 262.93 |
0.95 times |
Fri 07 November 2025 |
258.92 (0.71%) |
251.71 |
250.88 - 262.70 |
0.9726 times |
Fri 31 October 2025 |
257.09 (0%) |
255.95 |
253.38 - 257.92 |
0.2523 times |
Fri 31 October 2025 |
257.09 (-1.23%) |
262.73 |
247.50 - 266.44 |
1.3261 times |
Fri 24 October 2025 |
260.29 (4.99%) |
250.10 |
247.71 - 263.30 |
1.213 times |
Fri 17 October 2025 |
247.92 (0.76%) |
248.14 |
238.34 - 256.36 |
1.3642 times |
Fri 10 October 2025 |
246.04 (-4.79%) |
260.81 |
244.99 - 263.94 |
1.0339 times |
Fri 03 October 2025 |
258.41 (-1.16%) |
262.46 |
256.50 - 262.46 |
0.7756 times |
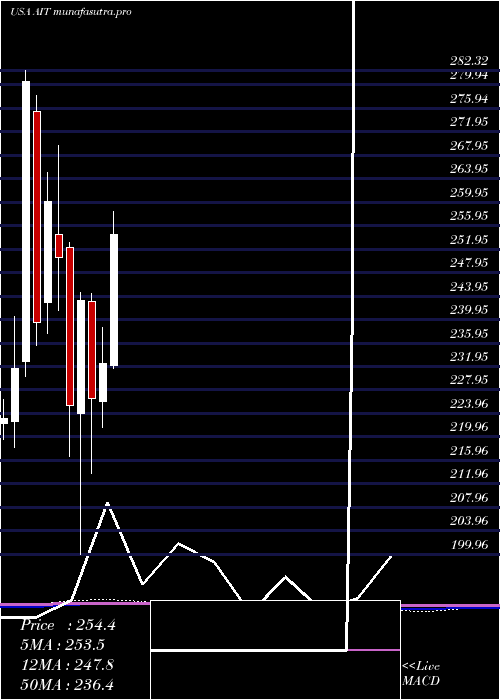
Monthly price and charts AppliedIndustrial Strong monthly Stock price targets for AppliedIndustrial AIT are 256.31 and 264.53 | Monthly Target 1 | 250.29 | | Monthly Target 2 | 254.1 | | Monthly Target 3 | 258.51 | | Monthly Target 4 | 262.32 | | Monthly Target 5 | 266.73 |
Monthly price and volumes Applied Industrial
| Date |
Closing |
Open |
Range |
Volume |
Fri 05 December 2025 |
257.91 (-0.35%) |
256.62 |
254.70 - 262.92 |
0.1672 times |
Fri 28 November 2025 |
258.82 (0.67%) |
251.71 |
238.72 - 262.93 |
0.6575 times |
Fri 31 October 2025 |
257.09 (-1.52%) |
259.24 |
238.34 - 266.44 |
0.9622 times |
Tue 30 September 2025 |
261.05 (-0.96%) |
259.31 |
256.50 - 270.71 |
0.6234 times |
Fri 29 August 2025 |
263.58 (-2.92%) |
267.53 |
255.00 - 280.95 |
0.8761 times |
Thu 31 July 2025 |
271.50 (16.8%) |
232.19 |
231.61 - 276.83 |
1.1631 times |
Mon 30 June 2025 |
232.45 (2.62%) |
225.96 |
221.52 - 238.64 |
1.8969 times |
Fri 30 May 2025 |
226.52 (-6.89%) |
242.99 |
213.78 - 244.34 |
1.3203 times |
Wed 30 April 2025 |
243.28 (7.96%) |
223.89 |
199.96 - 244.61 |
1.25 times |
Mon 31 March 2025 |
225.34 (-10.07%) |
252.24 |
216.67 - 253.16 |
1.0833 times |
Fri 28 February 2025 |
250.58 (-3.63%) |
254.44 |
241.58 - 269.69 |
0.6813 times |
DMA SMA EMA moving averages of Applied Industrial AIT
DMA (daily moving average) of Applied Industrial AIT
| DMA period | DMA value | | 5 day DMA | 258.28 | | 12 day DMA | 253.97 | | 20 day DMA | 253.06 | | 35 day DMA | 254.5 | | 50 day DMA | 254.41 | | 100 day DMA | 259.76 | | 150 day DMA | 250.87 | | 200 day DMA | 245.5 | EMA (exponential moving average) of Applied Industrial AIT
| EMA period | EMA current | EMA prev | EMA prev2 | | 5 day EMA | 257.96 | 257.98 | 257.56 | | 12 day EMA | 255.76 | 255.37 | 254.74 | | 20 day EMA | 254.86 | 254.54 | 254.09 | | 35 day EMA | 254.61 | 254.42 | 254.16 | | 50 day EMA | 255.41 | 255.31 | 255.17 |
SMA (simple moving average) of Applied Industrial AIT
| SMA period | SMA current | SMA prev | SMA prev2 | | 5 day SMA | 258.28 | 258.46 | 258.16 | | 12 day SMA | 253.97 | 252.69 | 251.17 | | 20 day SMA | 253.06 | 253.14 | 253.1 | | 35 day SMA | 254.5 | 254.12 | 253.81 | | 50 day SMA | 254.41 | 254.43 | 254.44 | | 100 day SMA | 259.76 | 259.73 | 259.69 | | 150 day SMA | 250.87 | 250.67 | 250.57 | | 200 day SMA | 245.5 | 245.54 | 245.59 |
|
|
