AlbanyInternational AIN full analysis,charts,indicators,moving averages,SMA,DMA,EMA,ADX,MACD,RSIAlbany International AIN WideScreen charts, DMA,SMA,EMA technical analysis, forecast prediction, by indicators ADX,MACD,RSI,CCI USA stock exchange
operates under Basic Industries sector & deals in Textiles
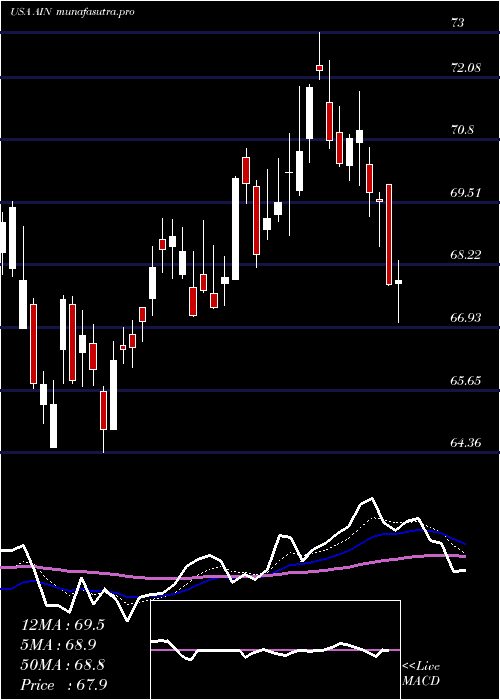
Daily price and charts and targets AlbanyInternational Strong Daily Stock price targets for AlbanyInternational AIN are 48.14 and 49.3 | Daily Target 1 | 47.2 | | Daily Target 2 | 47.92 | | Daily Target 3 | 48.363333333333 | | Daily Target 4 | 49.08 | | Daily Target 5 | 49.52 |
Daily price and volume Albany International
| Date |
Closing |
Open |
Range |
Volume |
Thu 04 December 2025 |
48.63 (1.27%) |
47.91 |
47.65 - 48.81 |
0.7159 times |
Wed 03 December 2025 |
48.02 (1.65%) |
47.98 |
47.42 - 48.36 |
0.7089 times |
Tue 02 December 2025 |
47.24 (-0.48%) |
47.67 |
46.52 - 47.67 |
0.6984 times |
Mon 01 December 2025 |
47.47 (-0.44%) |
47.17 |
46.99 - 48.12 |
1.2314 times |
Fri 28 November 2025 |
47.68 (0.61%) |
47.60 |
47.16 - 47.89 |
0.4886 times |
Wed 26 November 2025 |
47.39 (-0.34%) |
46.93 |
46.93 - 48.21 |
0.8749 times |
Tue 25 November 2025 |
47.55 (4.53%) |
45.74 |
45.52 - 48.14 |
1.0456 times |
Mon 24 November 2025 |
45.49 (0.18%) |
45.23 |
44.83 - 45.61 |
1.0372 times |
Fri 21 November 2025 |
45.41 (2.46%) |
44.33 |
44.23 - 46.10 |
1.0471 times |
Thu 20 November 2025 |
44.32 (5.15%) |
42.89 |
42.80 - 44.36 |
2.1521 times |
Wed 19 November 2025 |
42.15 (-0.47%) |
42.28 |
41.29 - 42.66 |
2.9915 times |
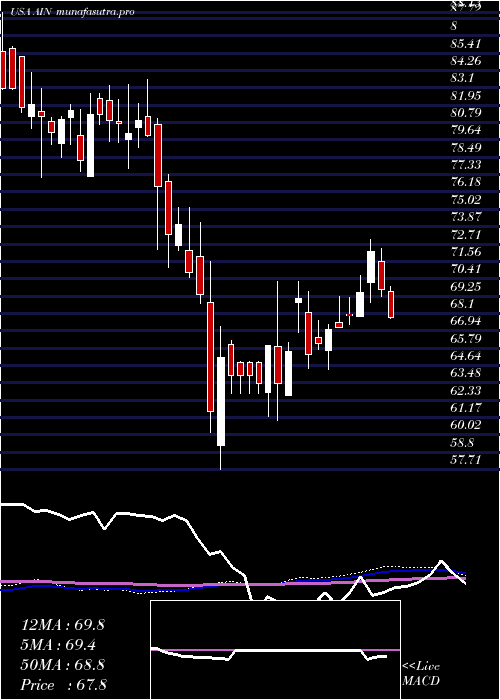
Weekly price and charts AlbanyInternational Strong weekly Stock price targets for AlbanyInternational AIN are 47.58 and 49.87 | Weekly Target 1 | 45.7 | | Weekly Target 2 | 47.16 | | Weekly Target 3 | 47.986666666667 | | Weekly Target 4 | 49.45 | | Weekly Target 5 | 50.28 |
Weekly price and volumes for Albany International
| Date |
Closing |
Open |
Range |
Volume |
Thu 04 December 2025 |
48.63 (1.99%) |
47.17 |
46.52 - 48.81 |
0.7296 times |
Fri 28 November 2025 |
47.68 (5%) |
45.23 |
44.83 - 48.21 |
0.7496 times |
Fri 21 November 2025 |
45.41 (0.62%) |
45.29 |
41.15 - 46.10 |
2.2526 times |
Fri 14 November 2025 |
45.13 (-6.45%) |
48.68 |
43.87 - 48.68 |
1.391 times |
Fri 07 November 2025 |
48.24 (-14.74%) |
55.81 |
47.65 - 56.91 |
1.8499 times |
Fri 31 October 2025 |
56.58 (0%) |
56.54 |
55.16 - 57.02 |
0.1753 times |
Fri 31 October 2025 |
56.58 (-6.11%) |
60.46 |
55.16 - 61.17 |
0.9881 times |
Fri 24 October 2025 |
60.26 (7.3%) |
56.57 |
56.55 - 61.21 |
0.5932 times |
Fri 17 October 2025 |
56.16 (4.6%) |
53.96 |
53.92 - 57.61 |
0.5942 times |
Fri 10 October 2025 |
53.69 (-3.1%) |
55.59 |
53.59 - 57.05 |
0.6765 times |
Fri 03 October 2025 |
55.41 (3.45%) |
53.97 |
52.14 - 55.76 |
1.0788 times |
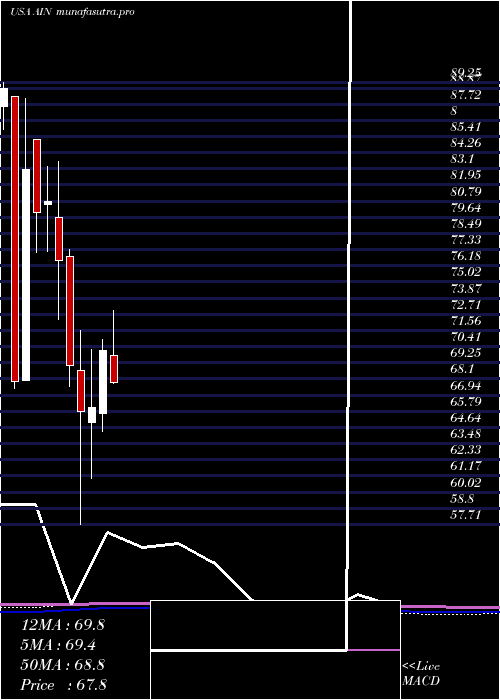
Monthly price and charts AlbanyInternational Strong monthly Stock price targets for AlbanyInternational AIN are 47.58 and 49.87 | Monthly Target 1 | 45.7 | | Monthly Target 2 | 47.16 | | Monthly Target 3 | 47.986666666667 | | Monthly Target 4 | 49.45 | | Monthly Target 5 | 50.28 |
Monthly price and volumes Albany International
| Date |
Closing |
Open |
Range |
Volume |
Thu 04 December 2025 |
48.63 (1.99%) |
47.17 |
46.52 - 48.81 |
0.2154 times |
Fri 28 November 2025 |
47.68 (-15.73%) |
55.81 |
41.15 - 56.91 |
1.8434 times |
Fri 31 October 2025 |
56.58 (6.15%) |
53.19 |
52.86 - 61.21 |
1.0642 times |
Tue 30 September 2025 |
53.30 (-16.08%) |
62.50 |
52.14 - 63.69 |
0.9358 times |
Fri 29 August 2025 |
63.51 (17.2%) |
52.81 |
52.40 - 66.12 |
1.1522 times |
Thu 31 July 2025 |
54.19 (-22.73%) |
69.76 |
50.60 - 73.00 |
0.9906 times |
Mon 30 June 2025 |
70.13 (6.14%) |
65.61 |
64.36 - 70.93 |
1.0882 times |
Fri 30 May 2025 |
66.07 (0.47%) |
64.95 |
60.98 - 70.21 |
0.8555 times |
Wed 30 April 2025 |
65.76 (-4.75%) |
68.71 |
57.71 - 71.54 |
0.8012 times |
Mon 31 March 2025 |
69.04 (-9.83%) |
76.84 |
67.59 - 77.36 |
1.0535 times |
Fri 28 February 2025 |
76.57 (-5.18%) |
79.63 |
72.36 - 83.65 |
0.53 times |
DMA SMA EMA moving averages of Albany International AIN
DMA (daily moving average) of Albany International AIN
| DMA period | DMA value | | 5 day DMA | 47.81 | | 12 day DMA | 46.14 | | 20 day DMA | 46.35 | | 35 day DMA | 51.14 | | 50 day DMA | 52.24 | | 100 day DMA | 57.6 | | 150 day DMA | 60.98 | | 200 day DMA | 63.27 | EMA (exponential moving average) of Albany International AIN
| EMA period | EMA current | EMA prev | EMA prev2 | | 5 day EMA | 47.79 | 47.37 | 47.05 | | 12 day EMA | 47.28 | 47.04 | 46.86 | | 20 day EMA | 47.97 | 47.9 | 47.89 | | 35 day EMA | 49.55 | 49.6 | 49.69 | | 50 day EMA | 52.12 | 52.26 | 52.43 |
SMA (simple moving average) of Albany International AIN
| SMA period | SMA current | SMA prev | SMA prev2 | | 5 day SMA | 47.81 | 47.56 | 47.47 | | 12 day SMA | 46.14 | 45.54 | 45.3 | | 20 day SMA | 46.35 | 46.65 | 47 | | 35 day SMA | 51.14 | 51.37 | 51.6 | | 50 day SMA | 52.24 | 52.35 | 52.51 | | 100 day SMA | 57.6 | 57.79 | 58 | | 150 day SMA | 60.98 | 61.09 | 61.22 | | 200 day SMA | 63.27 | 63.44 | 63.6 |
|
|
