AmericanInternational AIG full analysis,charts,indicators,moving averages,SMA,DMA,EMA,ADX,MACD,RSIAmerican International AIG WideScreen charts, DMA,SMA,EMA technical analysis, forecast prediction, by indicators ADX,MACD,RSI,CCI USA stock exchange
operates under Finance sector & deals in Property Casualty Insurers
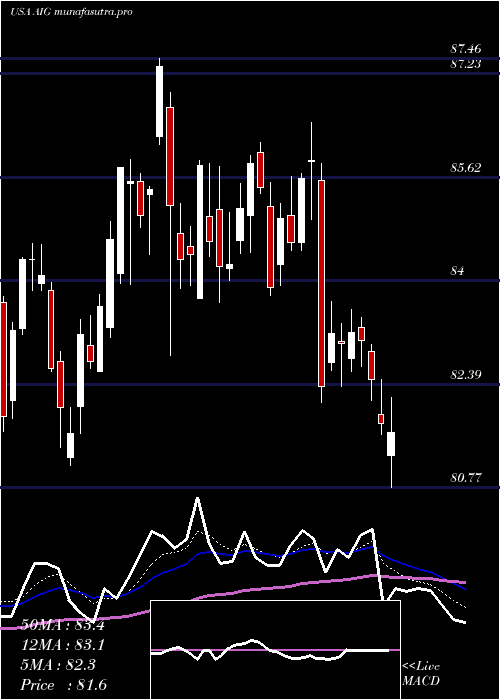
Daily price and charts and targets AmericanInternational Strong Daily Stock price targets for AmericanInternational AIG are 77.4 and 78.34 | Daily Target 1 | 76.68 | | Daily Target 2 | 77.18 | | Daily Target 3 | 77.616666666667 | | Daily Target 4 | 78.12 | | Daily Target 5 | 78.56 |
Daily price and volume American International
| Date |
Closing |
Open |
Range |
Volume |
Mon 20 October 2025 |
77.69 (0.43%) |
77.51 |
77.11 - 78.05 |
0.5834 times |
Fri 17 October 2025 |
77.36 (0.44%) |
77.19 |
77.19 - 78.21 |
0.8521 times |
Thu 16 October 2025 |
77.02 (-5.22%) |
78.31 |
76.95 - 79.73 |
2.1974 times |
Wed 15 October 2025 |
81.26 (-1.99%) |
82.21 |
80.47 - 82.73 |
1.1303 times |
Tue 14 October 2025 |
82.91 (1.33%) |
81.63 |
81.37 - 83.12 |
0.7362 times |
Mon 13 October 2025 |
81.82 (0.64%) |
81.11 |
80.83 - 82.12 |
0.5763 times |
Fri 10 October 2025 |
81.30 (-2.25%) |
83.56 |
81.15 - 83.69 |
1.0612 times |
Thu 09 October 2025 |
83.17 (-0.99%) |
84.25 |
82.78 - 84.50 |
0.8744 times |
Wed 08 October 2025 |
84.00 (-0.06%) |
84.50 |
83.14 - 84.69 |
0.7367 times |
Tue 07 October 2025 |
84.05 (1.24%) |
83.22 |
82.86 - 84.12 |
1.2519 times |
Mon 06 October 2025 |
83.02 (2.47%) |
81.44 |
81.32 - 83.17 |
0.7672 times |
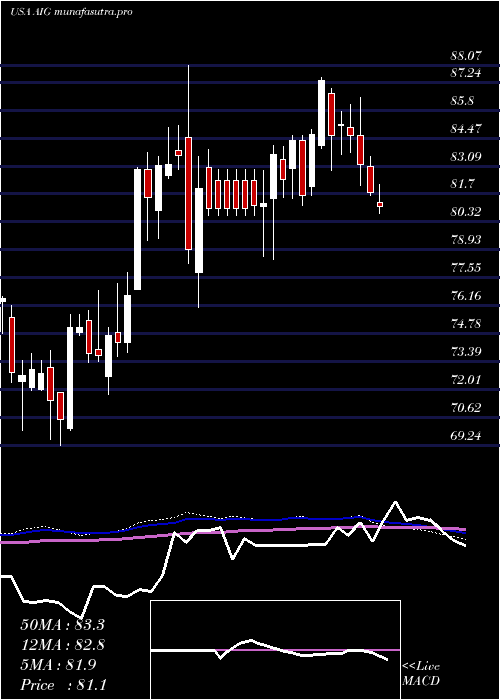
Weekly price and charts AmericanInternational Strong weekly Stock price targets for AmericanInternational AIG are 77.4 and 78.34 | Weekly Target 1 | 76.68 | | Weekly Target 2 | 77.18 | | Weekly Target 3 | 77.616666666667 | | Weekly Target 4 | 78.12 | | Weekly Target 5 | 78.56 |
Weekly price and volumes for American International
| Date |
Closing |
Open |
Range |
Volume |
Mon 20 October 2025 |
77.69 (0.43%) |
77.51 |
77.11 - 78.05 |
0.1443 times |
Fri 17 October 2025 |
77.36 (-4.85%) |
81.11 |
76.95 - 83.12 |
1.3587 times |
Fri 10 October 2025 |
81.30 (0.35%) |
81.44 |
81.15 - 84.69 |
1.1606 times |
Fri 03 October 2025 |
81.02 (3.9%) |
77.82 |
77.44 - 81.44 |
0.9141 times |
Fri 26 September 2025 |
77.98 (1.3%) |
76.66 |
76.03 - 78.47 |
1.0839 times |
Fri 19 September 2025 |
76.98 (-2.47%) |
78.86 |
75.90 - 78.93 |
2.0726 times |
Fri 12 September 2025 |
78.93 (-0.35%) |
78.93 |
77.72 - 79.27 |
1.1628 times |
Fri 05 September 2025 |
79.21 (-2.59%) |
81.38 |
78.84 - 81.95 |
0.9283 times |
Fri 29 August 2025 |
81.32 (0%) |
81.96 |
81.19 - 82.15 |
0.2112 times |
Fri 29 August 2025 |
81.32 (-2.47%) |
83.22 |
81.20 - 83.34 |
0.9635 times |
Fri 22 August 2025 |
83.38 (4.21%) |
79.80 |
79.36 - 83.78 |
0.8371 times |
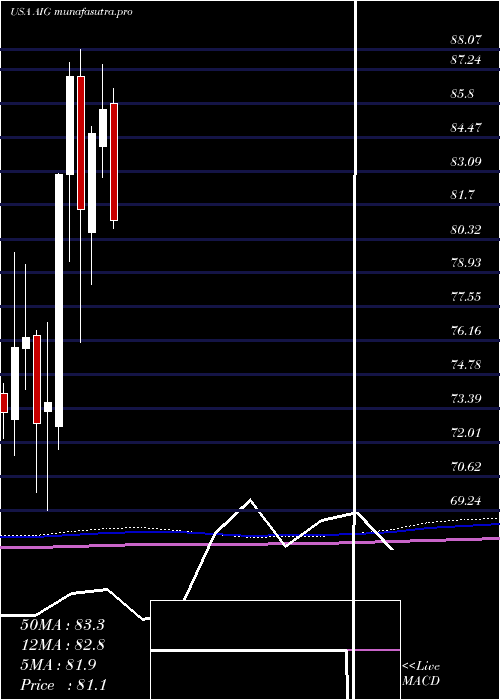
Monthly price and charts AmericanInternational Strong monthly Stock price targets for AmericanInternational AIG are 73.45 and 81.19 | Monthly Target 1 | 72.04 | | Monthly Target 2 | 74.86 | | Monthly Target 3 | 79.776666666667 | | Monthly Target 4 | 82.6 | | Monthly Target 5 | 87.52 |
Monthly price and volumes American International
| Date |
Closing |
Open |
Range |
Volume |
Mon 20 October 2025 |
77.69 (-1.08%) |
78.44 |
76.95 - 84.69 |
0.6663 times |
Tue 30 September 2025 |
78.54 (-3.42%) |
81.38 |
75.90 - 81.95 |
1.1957 times |
Fri 29 August 2025 |
81.32 (4.75%) |
77.40 |
75.26 - 83.78 |
0.8744 times |
Thu 31 July 2025 |
77.63 (-9.3%) |
85.86 |
76.85 - 86.47 |
1.0287 times |
Mon 30 June 2025 |
85.59 (1.12%) |
84.11 |
82.84 - 87.46 |
0.9282 times |
Fri 30 May 2025 |
84.64 (3.83%) |
80.60 |
78.45 - 84.92 |
0.8529 times |
Wed 30 April 2025 |
81.52 (-6.23%) |
86.97 |
76.09 - 88.07 |
1.1135 times |
Mon 31 March 2025 |
86.94 (4.82%) |
82.94 |
79.40 - 87.51 |
1.3548 times |
Fri 28 February 2025 |
82.94 (12.6%) |
72.66 |
71.74 - 83.00 |
0.9725 times |
Fri 31 January 2025 |
73.66 (1.18%) |
73.30 |
69.24 - 76.93 |
1.013 times |
Tue 31 December 2024 |
72.80 (-4.59%) |
76.38 |
69.97 - 76.60 |
0.7774 times |
DMA SMA EMA moving averages of American International AIG
DMA (daily moving average) of American International AIG
| DMA period | DMA value | | 5 day DMA | 79.25 | | 12 day DMA | 81.22 | | 20 day DMA | 80 | | 35 day DMA | 79.37 | | 50 day DMA | 79.97 | | 100 day DMA | 81.2 | | 150 day DMA | 81.61 | | 200 day DMA | 80.37 | EMA (exponential moving average) of American International AIG
| EMA period | EMA current | EMA prev | EMA prev2 | | 5 day EMA | 78.8 | 79.35 | 80.35 | | 12 day EMA | 79.86 | 80.25 | 80.78 | | 20 day EMA | 79.92 | 80.16 | 80.45 | | 35 day EMA | 80.01 | 80.15 | 80.31 | | 50 day EMA | 79.74 | 79.82 | 79.92 |
SMA (simple moving average) of American International AIG
| SMA period | SMA current | SMA prev | SMA prev2 | | 5 day SMA | 79.25 | 80.07 | 80.86 | | 12 day SMA | 81.22 | 81.38 | 81.57 | | 20 day SMA | 80 | 79.94 | 79.92 | | 35 day SMA | 79.37 | 79.47 | 79.59 | | 50 day SMA | 79.97 | 79.99 | 80.01 | | 100 day SMA | 81.2 | 81.25 | 81.3 | | 150 day SMA | 81.61 | 81.65 | 81.7 | | 200 day SMA | 80.37 | 80.35 | 80.33 |
|
|
