AgncInvestment AGNCN full analysis,charts,indicators,moving averages,SMA,DMA,EMA,ADX,MACD,RSIAgnc Investment AGNCN WideScreen charts, DMA,SMA,EMA technical analysis, forecast prediction, by indicators ADX,MACD,RSI,CCI USA stock exchange
operates under Consumer Services sector & deals in Real Estate Investment Trusts
Daily price and charts and targets AgncInvestment Strong Daily Stock price targets for AgncInvestment AGNCN are 25.46 and 25.54 | Daily Target 1 | 25.44 | | Daily Target 2 | 25.47 | | Daily Target 3 | 25.52 | | Daily Target 4 | 25.55 | | Daily Target 5 | 25.6 |
Daily price and volume Agnc Investment
| Date |
Closing |
Open |
Range |
Volume |
Thu 04 December 2025 |
25.50 (0%) |
25.51 |
25.49 - 25.57 |
0.442 times |
Wed 03 December 2025 |
25.50 (0.12%) |
25.47 |
25.47 - 25.58 |
0.7584 times |
Tue 02 December 2025 |
25.47 (0.35%) |
25.40 |
25.40 - 25.56 |
1.3009 times |
Mon 01 December 2025 |
25.38 (0.28%) |
25.31 |
25.31 - 25.40 |
1.5771 times |
Fri 28 November 2025 |
25.31 (0%) |
25.35 |
25.30 - 25.39 |
1.8835 times |
Wed 26 November 2025 |
25.31 (-0.28%) |
25.33 |
25.30 - 25.38 |
0.9292 times |
Tue 25 November 2025 |
25.38 (0.16%) |
25.37 |
25.28 - 25.39 |
0.6128 times |
Mon 24 November 2025 |
25.34 (0.12%) |
25.23 |
25.23 - 25.39 |
0.3817 times |
Fri 21 November 2025 |
25.31 (0.36%) |
25.22 |
25.22 - 25.40 |
1.1401 times |
Thu 20 November 2025 |
25.22 (-0.75%) |
25.50 |
25.22 - 25.50 |
0.9744 times |
Wed 19 November 2025 |
25.41 (0.04%) |
25.35 |
25.27 - 25.47 |
0.4822 times |
Weekly price and charts AgncInvestment Strong weekly Stock price targets for AgncInvestment AGNCN are 25.41 and 25.68 | Weekly Target 1 | 25.19 | | Weekly Target 2 | 25.35 | | Weekly Target 3 | 25.463333333333 | | Weekly Target 4 | 25.62 | | Weekly Target 5 | 25.73 |
Weekly price and volumes for Agnc Investment
| Date |
Closing |
Open |
Range |
Volume |
Thu 04 December 2025 |
25.50 (0.75%) |
25.31 |
25.31 - 25.58 |
0.8126 times |
Fri 28 November 2025 |
25.31 (0%) |
25.23 |
25.23 - 25.39 |
0.7585 times |
Fri 21 November 2025 |
25.31 (-0.2%) |
25.43 |
25.18 - 25.50 |
1.7632 times |
Fri 14 November 2025 |
25.36 (-0.31%) |
25.61 |
25.35 - 25.68 |
1.1618 times |
Fri 07 November 2025 |
25.44 (-0.08%) |
25.41 |
25.36 - 25.60 |
1.2649 times |
Fri 31 October 2025 |
25.46 (0%) |
25.70 |
25.44 - 25.70 |
0.4653 times |
Fri 31 October 2025 |
25.46 (-0.74%) |
25.61 |
25.44 - 25.72 |
0.8826 times |
Fri 24 October 2025 |
25.65 (0.87%) |
25.59 |
25.55 - 25.76 |
0.5514 times |
Fri 17 October 2025 |
25.43 (-0.66%) |
25.69 |
25.42 - 25.71 |
1.2919 times |
Fri 10 October 2025 |
25.60 (-0.31%) |
25.70 |
25.58 - 25.78 |
1.0477 times |
Fri 03 October 2025 |
25.68 (-0.93%) |
25.92 |
25.51 - 26.11 |
1.7266 times |

Monthly price and charts AgncInvestment Strong monthly Stock price targets for AgncInvestment AGNCN are 25.41 and 25.68 | Monthly Target 1 | 25.19 | | Monthly Target 2 | 25.35 | | Monthly Target 3 | 25.463333333333 | | Monthly Target 4 | 25.62 | | Monthly Target 5 | 25.73 |
Monthly price and volumes Agnc Investment
| Date |
Closing |
Open |
Range |
Volume |
Thu 04 December 2025 |
25.50 (0.75%) |
25.31 |
25.31 - 25.58 |
0.1529 times |
Fri 28 November 2025 |
25.31 (-0.59%) |
25.41 |
25.18 - 25.68 |
0.9313 times |
Fri 31 October 2025 |
25.46 (-2.34%) |
25.51 |
25.42 - 25.78 |
0.973 times |
Tue 30 September 2025 |
26.07 (2.16%) |
25.54 |
25.54 - 26.11 |
1.1059 times |
Fri 29 August 2025 |
25.52 (-1.39%) |
25.81 |
25.51 - 25.93 |
0.7725 times |
Thu 31 July 2025 |
25.88 (1.61%) |
25.00 |
25.00 - 25.93 |
1.1767 times |
Mon 30 June 2025 |
25.47 (0.24%) |
25.46 |
25.32 - 25.94 |
1.1494 times |
Fri 30 May 2025 |
25.41 (0.04%) |
25.46 |
25.37 - 25.77 |
0.5795 times |
Wed 30 April 2025 |
25.40 (-2.57%) |
25.52 |
23.63 - 25.62 |
2.1762 times |
Mon 31 March 2025 |
26.07 (1.05%) |
25.87 |
25.79 - 26.59 |
0.9826 times |
Fri 28 February 2025 |
25.80 (0.7%) |
25.60 |
25.60 - 25.92 |
0.5367 times |

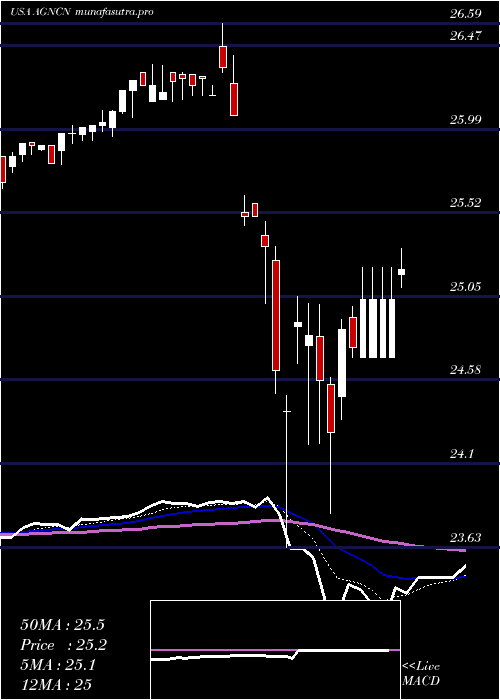
DMA SMA EMA moving averages of Agnc Investment AGNCN
DMA (daily moving average) of Agnc Investment AGNCN
| DMA period | DMA value | | 5 day DMA | 25.43 | | 12 day DMA | 25.38 | | 20 day DMA | 25.42 | | 35 day DMA | 25.48 | | 50 day DMA | 25.55 | | 100 day DMA | 25.65 | | 150 day DMA | 25.62 | | 200 day DMA | 25.61 | EMA (exponential moving average) of Agnc Investment AGNCN
| EMA period | EMA current | EMA prev | EMA prev2 | | 5 day EMA | 25.45 | 25.43 | 25.39 | | 12 day EMA | 25.42 | 25.41 | 25.39 | | 20 day EMA | 25.44 | 25.43 | 25.42 | | 35 day EMA | 25.49 | 25.49 | 25.49 | | 50 day EMA | 25.57 | 25.57 | 25.57 |
SMA (simple moving average) of Agnc Investment AGNCN
| SMA period | SMA current | SMA prev | SMA prev2 | | 5 day SMA | 25.43 | 25.39 | 25.37 | | 12 day SMA | 25.38 | 25.36 | 25.35 | | 20 day SMA | 25.42 | 25.42 | 25.41 | | 35 day SMA | 25.48 | 25.49 | 25.49 | | 50 day SMA | 25.55 | 25.56 | 25.56 | | 100 day SMA | 25.65 | 25.64 | 25.64 | | 150 day SMA | 25.62 | 25.62 | 25.62 | | 200 day SMA | 25.61 | 25.61 | 25.61 |
|
|
