AgncInvestment AGNC full analysis,charts,indicators,moving averages,SMA,DMA,EMA,ADX,MACD,RSIAgnc Investment AGNC WideScreen charts, DMA,SMA,EMA technical analysis, forecast prediction, by indicators ADX,MACD,RSI,CCI USA stock exchange
operates under Consumer Services sector & deals in Real Estate Investment Trusts
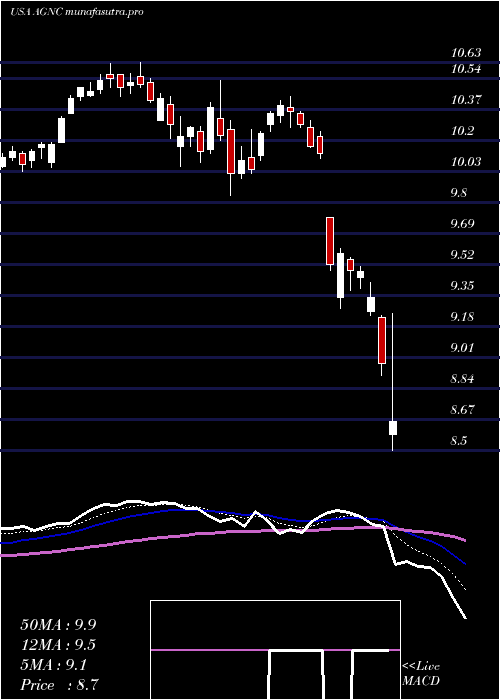
Daily price and charts and targets AgncInvestment Strong Daily Stock price targets for AgncInvestment AGNC are 10.46 and 10.57 | Daily Target 1 | 10.37 | | Daily Target 2 | 10.43 | | Daily Target 3 | 10.48 | | Daily Target 4 | 10.54 | | Daily Target 5 | 10.59 |
Daily price and volume Agnc Investment
| Date |
Closing |
Open |
Range |
Volume |
Thu 04 December 2025 |
10.49 (0.29%) |
10.48 |
10.42 - 10.53 |
0.5632 times |
Wed 03 December 2025 |
10.46 (0%) |
10.50 |
10.45 - 10.58 |
0.8012 times |
Tue 02 December 2025 |
10.46 (0%) |
10.50 |
10.45 - 10.54 |
0.6863 times |
Mon 01 December 2025 |
10.46 (-0.29%) |
10.41 |
10.39 - 10.49 |
1.0004 times |
Fri 28 November 2025 |
10.49 (-0.76%) |
10.48 |
10.47 - 10.58 |
0.7906 times |
Wed 26 November 2025 |
10.57 (1.63%) |
10.41 |
10.40 - 10.64 |
1.3021 times |
Tue 25 November 2025 |
10.40 (0.97%) |
10.31 |
10.27 - 10.41 |
1.7096 times |
Mon 24 November 2025 |
10.30 (0.19%) |
10.34 |
10.23 - 10.34 |
1.0333 times |
Fri 21 November 2025 |
10.28 (2.09%) |
10.09 |
10.07 - 10.33 |
1.1823 times |
Thu 20 November 2025 |
10.07 (-0.1%) |
10.11 |
10.06 - 10.23 |
0.9309 times |
Wed 19 November 2025 |
10.08 (-0.3%) |
10.12 |
10.05 - 10.14 |
0.7321 times |
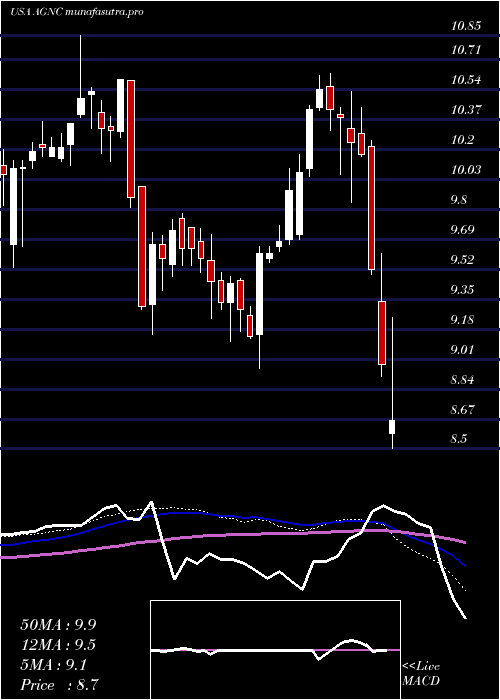
Weekly price and charts AgncInvestment Strong weekly Stock price targets for AgncInvestment AGNC are 10.44 and 10.63 | Weekly Target 1 | 10.3 | | Weekly Target 2 | 10.39 | | Weekly Target 3 | 10.486666666667 | | Weekly Target 4 | 10.58 | | Weekly Target 5 | 10.68 |
Weekly price and volumes for Agnc Investment
| Date |
Closing |
Open |
Range |
Volume |
Thu 04 December 2025 |
10.49 (0%) |
10.41 |
10.39 - 10.58 |
0.7269 times |
Fri 28 November 2025 |
10.49 (2.04%) |
10.34 |
10.23 - 10.64 |
1.152 times |
Fri 21 November 2025 |
10.28 (1.28%) |
10.18 |
10.05 - 10.33 |
1.0985 times |
Fri 14 November 2025 |
10.15 (-1.84%) |
10.35 |
10.05 - 10.38 |
1.1419 times |
Fri 07 November 2025 |
10.34 (3.4%) |
9.98 |
9.95 - 10.34 |
0.9342 times |
Fri 31 October 2025 |
10.00 (0%) |
9.95 |
9.85 - 10.03 |
0.2405 times |
Fri 31 October 2025 |
10.00 (-1.86%) |
10.27 |
9.85 - 10.36 |
1.4614 times |
Fri 24 October 2025 |
10.19 (2.1%) |
10.01 |
9.92 - 10.30 |
1.1936 times |
Fri 17 October 2025 |
9.98 (0.5%) |
9.97 |
9.84 - 10.09 |
0.9943 times |
Fri 10 October 2025 |
9.93 (-1.49%) |
10.11 |
9.86 - 10.22 |
1.0568 times |
Fri 03 October 2025 |
10.08 (2.44%) |
9.92 |
9.68 - 10.12 |
1.0824 times |
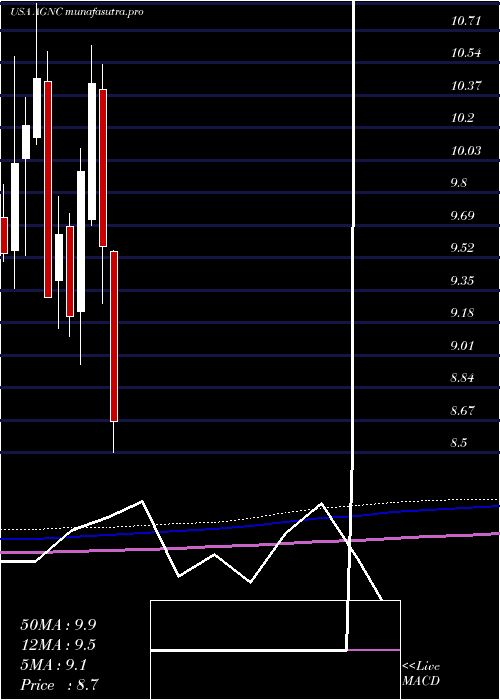
Monthly price and charts AgncInvestment Strong monthly Stock price targets for AgncInvestment AGNC are 10.44 and 10.63 | Monthly Target 1 | 10.3 | | Monthly Target 2 | 10.39 | | Monthly Target 3 | 10.486666666667 | | Monthly Target 4 | 10.58 | | Monthly Target 5 | 10.68 |
Monthly price and volumes Agnc Investment
| Date |
Closing |
Open |
Range |
Volume |
Thu 04 December 2025 |
10.49 (0%) |
10.41 |
10.39 - 10.58 |
0.1428 times |
Fri 28 November 2025 |
10.49 (4.9%) |
9.98 |
9.95 - 10.64 |
0.8501 times |
Fri 31 October 2025 |
10.00 (2.15%) |
9.78 |
9.74 - 10.36 |
1.0987 times |
Tue 30 September 2025 |
9.79 (0.31%) |
9.63 |
9.62 - 10.44 |
0.9992 times |
Fri 29 August 2025 |
9.76 (3.5%) |
9.44 |
9.31 - 9.92 |
0.7267 times |
Thu 31 July 2025 |
9.43 (2.61%) |
9.19 |
9.12 - 9.77 |
1.0321 times |
Mon 30 June 2025 |
9.19 (2.8%) |
8.90 |
8.80 - 9.44 |
1.0087 times |
Fri 30 May 2025 |
8.94 (1.25%) |
8.84 |
8.61 - 9.26 |
1.3704 times |
Wed 30 April 2025 |
8.83 (-7.83%) |
9.55 |
7.85 - 9.56 |
1.795 times |
Mon 31 March 2025 |
9.58 (-8.15%) |
10.40 |
9.28 - 10.53 |
0.9763 times |
Fri 28 February 2025 |
10.43 (4.61%) |
9.72 |
9.69 - 10.63 |
0.8588 times |
DMA SMA EMA moving averages of Agnc Investment AGNC
DMA (daily moving average) of Agnc Investment AGNC
| DMA period | DMA value | | 5 day DMA | 10.47 | | 12 day DMA | 10.35 | | 20 day DMA | 10.29 | | 35 day DMA | 10.21 | | 50 day DMA | 10.13 | | 100 day DMA | 9.94 | | 150 day DMA | 9.67 | | 200 day DMA | 9.62 | EMA (exponential moving average) of Agnc Investment AGNC
| EMA period | EMA current | EMA prev | EMA prev2 | | 5 day EMA | 10.46 | 10.45 | 10.44 | | 12 day EMA | 10.38 | 10.36 | 10.34 | | 20 day EMA | 10.33 | 10.31 | 10.29 | | 35 day EMA | 10.23 | 10.21 | 10.2 | | 50 day EMA | 10.13 | 10.12 | 10.11 |
SMA (simple moving average) of Agnc Investment AGNC
| SMA period | SMA current | SMA prev | SMA prev2 | | 5 day SMA | 10.47 | 10.49 | 10.48 | | 12 day SMA | 10.35 | 10.32 | 10.29 | | 20 day SMA | 10.29 | 10.28 | 10.27 | | 35 day SMA | 10.21 | 10.2 | 10.19 | | 50 day SMA | 10.13 | 10.12 | 10.1 | | 100 day SMA | 9.94 | 9.93 | 9.92 | | 150 day SMA | 9.67 | 9.66 | 9.65 | | 200 day SMA | 9.62 | 9.62 | 9.62 |
|
|
