AgmGroup AGMH full analysis,charts,indicators,moving averages,SMA,DMA,EMA,ADX,MACD,RSIAgm Group AGMH WideScreen charts, DMA,SMA,EMA technical analysis, forecast prediction, by indicators ADX,MACD,RSI,CCI USA stock exchange
operates under Technology sector & deals in EDP Services
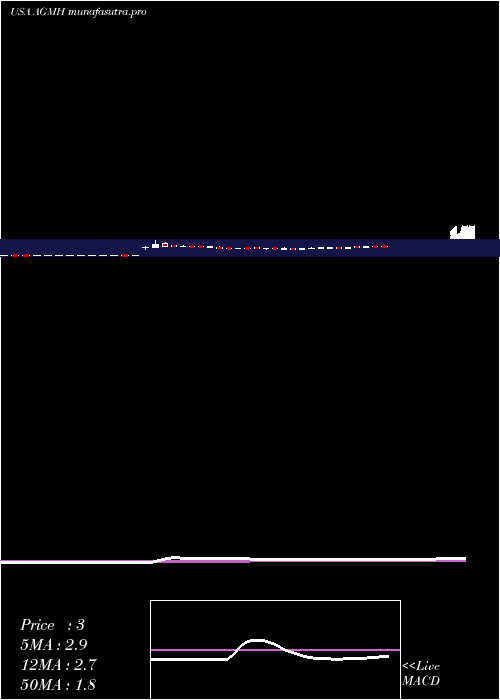
Daily price and charts and targets AgmGroup Strong Daily Stock price targets for AgmGroup AGMH are 2.71 and 2.84 | Daily Target 1 | 2.68 | | Daily Target 2 | 2.74 | | Daily Target 3 | 2.81 | | Daily Target 4 | 2.87 | | Daily Target 5 | 2.94 |
Daily price and volume Agm Group
| Date |
Closing |
Open |
Range |
Volume |
Thu 04 December 2025 |
2.80 (0%) |
2.88 |
2.75 - 2.88 |
0.6645 times |
Wed 03 December 2025 |
2.80 (-3.45%) |
2.90 |
2.71 - 2.90 |
0.5348 times |
Tue 02 December 2025 |
2.90 (-5.54%) |
2.95 |
2.83 - 3.07 |
1.0697 times |
Mon 01 December 2025 |
3.07 (0.33%) |
3.12 |
2.90 - 3.12 |
0.8363 times |
Fri 28 November 2025 |
3.06 (6.62%) |
2.93 |
2.89 - 3.62 |
4.2853 times |
Wed 26 November 2025 |
2.87 (-2.05%) |
2.93 |
2.87 - 2.98 |
0.282 times |
Tue 25 November 2025 |
2.93 (0.69%) |
2.89 |
2.89 - 2.99 |
0.3857 times |
Mon 24 November 2025 |
2.91 (3.56%) |
2.79 |
2.79 - 2.95 |
0.2561 times |
Fri 21 November 2025 |
2.81 (-3.1%) |
2.89 |
2.80 - 2.93 |
1.0859 times |
Thu 20 November 2025 |
2.90 (-0.34%) |
2.92 |
2.80 - 2.98 |
0.5997 times |
Wed 19 November 2025 |
2.91 (-6.43%) |
3.05 |
2.90 - 3.18 |
0.9044 times |
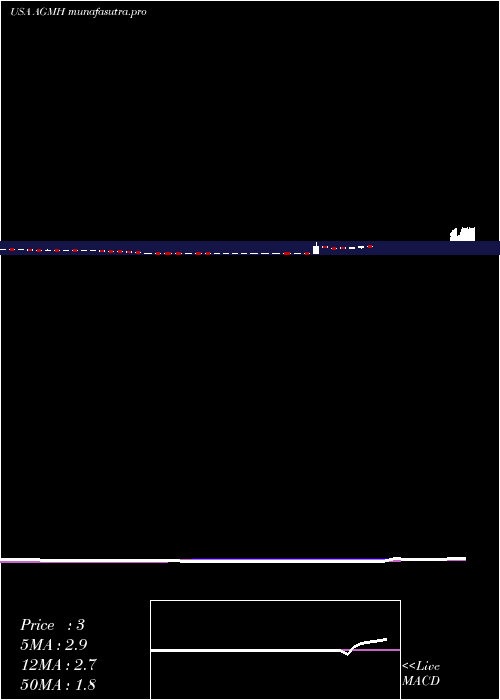
Weekly price and charts AgmGroup Strong weekly Stock price targets for AgmGroup AGMH are 2.55 and 2.96 | Weekly Target 1 | 2.47 | | Weekly Target 2 | 2.63 | | Weekly Target 3 | 2.8766666666667 | | Weekly Target 4 | 3.04 | | Weekly Target 5 | 3.29 |
Weekly price and volumes for Agm Group
| Date |
Closing |
Open |
Range |
Volume |
Thu 04 December 2025 |
2.80 (-8.5%) |
3.12 |
2.71 - 3.12 |
0.3701 times |
Fri 28 November 2025 |
3.06 (8.9%) |
2.79 |
2.79 - 3.62 |
0.6208 times |
Fri 21 November 2025 |
2.81 (-12.19%) |
3.21 |
2.80 - 3.27 |
0.4562 times |
Fri 14 November 2025 |
3.20 (-2.44%) |
3.34 |
2.84 - 3.45 |
0.4415 times |
Fri 07 November 2025 |
3.28 (-18.81%) |
3.75 |
3.12 - 3.75 |
0.5062 times |
Fri 31 October 2025 |
4.04 (0%) |
4.00 |
3.92 - 4.22 |
0.1839 times |
Fri 31 October 2025 |
4.04 (-6.05%) |
4.29 |
3.92 - 4.58 |
0.7827 times |
Fri 24 October 2025 |
4.30 (-12.96%) |
4.85 |
3.90 - 4.85 |
1.3227 times |
Fri 17 October 2025 |
4.94 (-14.68%) |
5.77 |
4.55 - 5.77 |
2.3812 times |
Fri 10 October 2025 |
5.79 (-28.87%) |
8.17 |
5.75 - 8.17 |
2.9348 times |
Fri 03 October 2025 |
8.14 (-6%) |
8.40 |
7.59 - 9.49 |
4.4546 times |
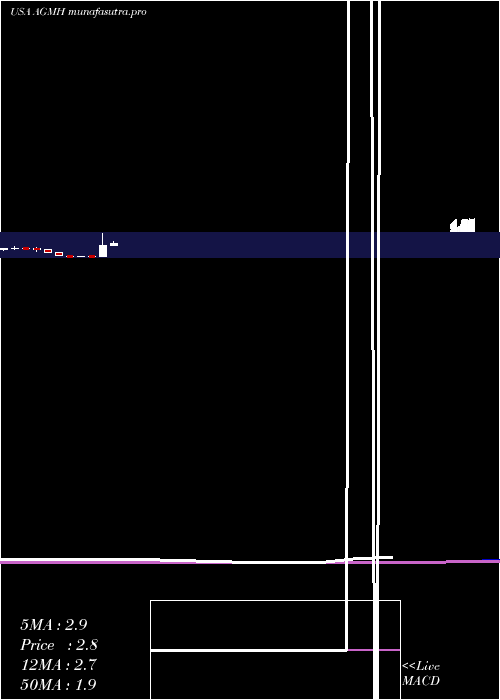
Monthly price and charts AgmGroup Strong monthly Stock price targets for AgmGroup AGMH are 2.55 and 2.96 | Monthly Target 1 | 2.47 | | Monthly Target 2 | 2.63 | | Monthly Target 3 | 2.8766666666667 | | Monthly Target 4 | 3.04 | | Monthly Target 5 | 3.29 |
Monthly price and volumes Agm Group
| Date |
Closing |
Open |
Range |
Volume |
Thu 04 December 2025 |
2.80 (-8.5%) |
3.12 |
2.71 - 3.12 |
0.0002 times |
Fri 28 November 2025 |
3.06 (-24.26%) |
3.75 |
2.79 - 3.75 |
0.001 times |
Fri 31 October 2025 |
4.04 (-51.44%) |
7.95 |
3.90 - 9.49 |
0.005 times |
Tue 30 September 2025 |
8.32 (324.49%) |
1.96 |
1.50 - 18.10 |
0.4372 times |
Fri 29 August 2025 |
1.96 (-7.55%) |
2.01 |
1.62 - 2.71 |
0.004 times |
Thu 31 July 2025 |
2.12 (-9.01%) |
2.33 |
2.11 - 3.21 |
0.0112 times |
Mon 30 June 2025 |
2.33 (3783.33%) |
0.06 |
0.06 - 4.93 |
0.0413 times |
Fri 30 May 2025 |
0.06 (-40%) |
0.11 |
0.06 - 0.11 |
1.9336 times |
Wed 30 April 2025 |
0.10 (100%) |
0.05 |
0.02 - 0.15 |
5.2476 times |
Mon 31 March 2025 |
0.05 (-84.85%) |
0.15 |
0.04 - 0.29 |
2.319 times |
Fri 28 February 2025 |
0.33 (-62.92%) |
0.87 |
0.32 - 0.90 |
0.0044 times |
DMA SMA EMA moving averages of Agm Group AGMH
DMA (daily moving average) of Agm Group AGMH
| DMA period | DMA value | | 5 day DMA | 2.93 | | 12 day DMA | 2.92 | | 20 day DMA | 3.06 | | 35 day DMA | 3.56 | | 50 day DMA | 4.62 | | 100 day DMA | 3.69 | | 150 day DMA | 2.97 | | 200 day DMA | 2.27 | EMA (exponential moving average) of Agm Group AGMH
| EMA period | EMA current | EMA prev | EMA prev2 | | 5 day EMA | 2.87 | 2.91 | 2.97 | | 12 day EMA | 2.98 | 3.01 | 3.05 | | 20 day EMA | 3.23 | 3.27 | 3.32 | | 35 day EMA | 3.94 | 4.01 | 4.08 | | 50 day EMA | 4.69 | 4.77 | 4.85 |
SMA (simple moving average) of Agm Group AGMH
| SMA period | SMA current | SMA prev | SMA prev2 | | 5 day SMA | 2.93 | 2.94 | 2.97 | | 12 day SMA | 2.92 | 2.95 | 2.98 | | 20 day SMA | 3.06 | 3.09 | 3.12 | | 35 day SMA | 3.56 | 3.62 | 3.68 | | 50 day SMA | 4.62 | 4.72 | 4.83 | | 100 day SMA | 3.69 | 3.69 | 3.69 | | 150 day SMA | 2.97 | 2.95 | 2.94 | | 200 day SMA | 2.27 | 2.26 | 2.25 |
|
|
