FederalAgricultural AGM full analysis,charts,indicators,moving averages,SMA,DMA,EMA,ADX,MACD,RSIFederal Agricultural AGM WideScreen charts, DMA,SMA,EMA technical analysis, forecast prediction, by indicators ADX,MACD,RSI,CCI USA stock exchange
operates under Finance sector & deals in Finance Companies
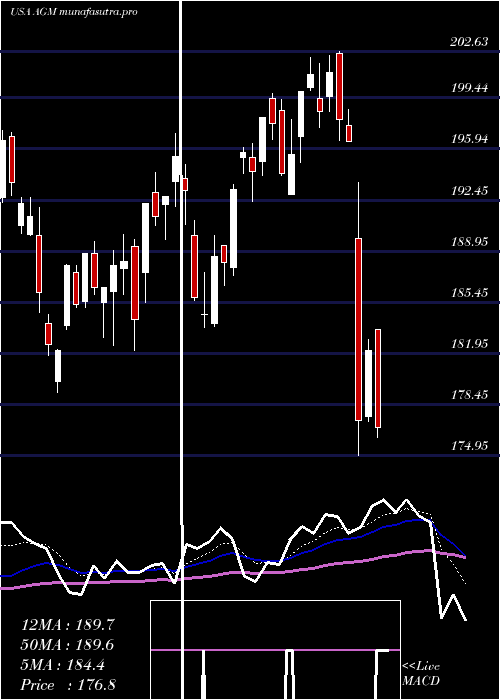
Daily price and charts and targets FederalAgricultural Strong Daily Stock price targets for FederalAgricultural AGM are 173.04 and 176.78 | Daily Target 1 | 172.12 | | Daily Target 2 | 173.96 | | Daily Target 3 | 175.86 | | Daily Target 4 | 177.7 | | Daily Target 5 | 179.6 |
Daily price and volume Federal Agricultural
| Date |
Closing |
Open |
Range |
Volume |
Fri 05 December 2025 |
175.80 (-0.05%) |
176.64 |
174.02 - 177.76 |
0.7747 times |
Thu 04 December 2025 |
175.89 (-0.58%) |
176.70 |
174.11 - 177.56 |
0.7929 times |
Wed 03 December 2025 |
176.92 (1.53%) |
174.91 |
174.91 - 179.64 |
1.1042 times |
Tue 02 December 2025 |
174.25 (0.55%) |
174.25 |
172.05 - 176.45 |
0.9352 times |
Mon 01 December 2025 |
173.29 (0.89%) |
170.75 |
170.18 - 175.15 |
1.3693 times |
Fri 28 November 2025 |
171.76 (-0.54%) |
171.80 |
170.36 - 173.08 |
0.4293 times |
Wed 26 November 2025 |
172.69 (0.78%) |
171.00 |
170.00 - 174.18 |
1.2879 times |
Tue 25 November 2025 |
171.35 (2.36%) |
167.92 |
167.50 - 171.49 |
0.5935 times |
Mon 24 November 2025 |
167.40 (1.64%) |
165.91 |
163.25 - 168.00 |
1.1589 times |
Fri 21 November 2025 |
164.70 (0.44%) |
165.38 |
164.36 - 168.21 |
1.5542 times |
Thu 20 November 2025 |
163.98 (-0.83%) |
165.46 |
163.36 - 169.17 |
1.4241 times |
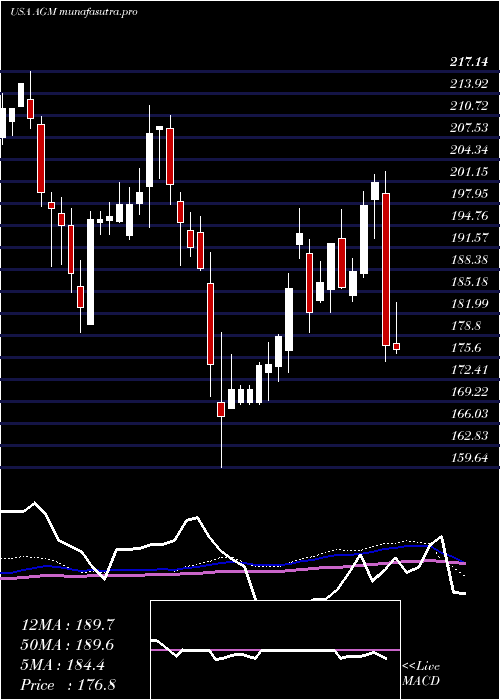
Weekly price and charts FederalAgricultural Strong weekly Stock price targets for FederalAgricultural AGM are 172.99 and 182.45 | Weekly Target 1 | 165.75 | | Weekly Target 2 | 170.77 | | Weekly Target 3 | 175.20666666667 | | Weekly Target 4 | 180.23 | | Weekly Target 5 | 184.67 |
Weekly price and volumes for Federal Agricultural
| Date |
Closing |
Open |
Range |
Volume |
Fri 05 December 2025 |
175.80 (2.35%) |
170.75 |
170.18 - 179.64 |
1.1852 times |
Fri 28 November 2025 |
171.76 (4.29%) |
165.91 |
163.25 - 174.18 |
0.8264 times |
Fri 21 November 2025 |
164.70 (0.35%) |
163.00 |
161.24 - 169.17 |
1.4123 times |
Fri 14 November 2025 |
164.13 (0.13%) |
164.02 |
162.31 - 169.69 |
1.3512 times |
Fri 07 November 2025 |
163.92 (3.33%) |
165.25 |
159.77 - 172.36 |
1.2579 times |
Fri 31 October 2025 |
158.64 (0%) |
155.11 |
155.11 - 158.75 |
0.1315 times |
Fri 31 October 2025 |
158.64 (-2.85%) |
163.40 |
155.11 - 164.15 |
0.6184 times |
Fri 24 October 2025 |
163.29 (4.59%) |
156.67 |
155.90 - 164.50 |
0.712 times |
Fri 17 October 2025 |
156.13 (-4.79%) |
164.02 |
155.00 - 166.54 |
1.0146 times |
Fri 10 October 2025 |
163.99 (0.53%) |
164.50 |
156.56 - 166.92 |
1.4904 times |
Fri 03 October 2025 |
163.12 (-5.67%) |
174.52 |
162.41 - 175.30 |
1.3325 times |
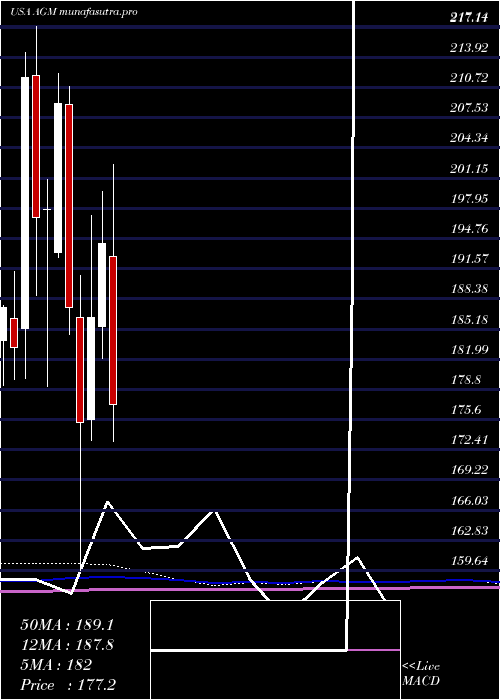
Monthly price and charts FederalAgricultural Strong monthly Stock price targets for FederalAgricultural AGM are 172.99 and 182.45 | Monthly Target 1 | 165.75 | | Monthly Target 2 | 170.77 | | Monthly Target 3 | 175.20666666667 | | Monthly Target 4 | 180.23 | | Monthly Target 5 | 184.67 |
Monthly price and volumes Federal Agricultural
| Date |
Closing |
Open |
Range |
Volume |
Fri 05 December 2025 |
175.80 (2.35%) |
170.75 |
170.18 - 179.64 |
0.261 times |
Fri 28 November 2025 |
171.76 (8.27%) |
165.25 |
159.77 - 174.18 |
1.0675 times |
Fri 31 October 2025 |
158.64 (-5.56%) |
166.82 |
155.00 - 167.93 |
1.0574 times |
Tue 30 September 2025 |
167.98 (-19.85%) |
206.82 |
166.50 - 209.18 |
1.0446 times |
Fri 29 August 2025 |
209.57 (21.65%) |
171.77 |
168.31 - 210.64 |
0.9665 times |
Thu 31 July 2025 |
172.27 (-11.33%) |
192.83 |
170.81 - 202.63 |
1.3438 times |
Mon 30 June 2025 |
194.28 (4.22%) |
185.41 |
182.10 - 199.75 |
2.6116 times |
Fri 30 May 2025 |
186.42 (6.33%) |
175.64 |
173.42 - 197.21 |
0.5701 times |
Wed 30 April 2025 |
175.33 (-6.5%) |
186.43 |
159.64 - 190.83 |
0.5851 times |
Mon 31 March 2025 |
187.51 (-10.31%) |
208.89 |
184.62 - 210.78 |
0.4924 times |
Fri 28 February 2025 |
209.07 (5.71%) |
193.32 |
192.76 - 212.24 |
0.424 times |
DMA SMA EMA moving averages of Federal Agricultural AGM
DMA (daily moving average) of Federal Agricultural AGM
| DMA period | DMA value | | 5 day DMA | 175.23 | | 12 day DMA | 171.12 | | 20 day DMA | 168.55 | | 35 day DMA | 165.35 | | 50 day DMA | 164.75 | | 100 day DMA | 176.45 | | 150 day DMA | 180.68 | | 200 day DMA | 182.04 | EMA (exponential moving average) of Federal Agricultural AGM
| EMA period | EMA current | EMA prev | EMA prev2 | | 5 day EMA | 174.91 | 174.46 | 173.75 | | 12 day EMA | 172.02 | 171.33 | 170.5 | | 20 day EMA | 169.9 | 169.28 | 168.59 | | 35 day EMA | 168.3 | 167.86 | 167.39 | | 50 day EMA | 167.06 | 166.7 | 166.33 |
SMA (simple moving average) of Federal Agricultural AGM
| SMA period | SMA current | SMA prev | SMA prev2 | | 5 day SMA | 175.23 | 174.42 | 173.78 | | 12 day SMA | 171.12 | 169.98 | 168.9 | | 20 day SMA | 168.55 | 167.87 | 167.58 | | 35 day SMA | 165.35 | 164.76 | 164.41 | | 50 day SMA | 164.75 | 164.78 | 164.84 | | 100 day SMA | 176.45 | 176.47 | 176.48 | | 150 day SMA | 180.68 | 180.67 | 180.67 | | 200 day SMA | 182.04 | 182.16 | 182.27 |
|
|
