AflacIncorporated AFL full analysis,charts,indicators,moving averages,SMA,DMA,EMA,ADX,MACD,RSIAflac Incorporated AFL WideScreen charts, DMA,SMA,EMA technical analysis, forecast prediction, by indicators ADX,MACD,RSI,CCI USA stock exchange
operates under Finance sector & deals in Accident Health Insurance
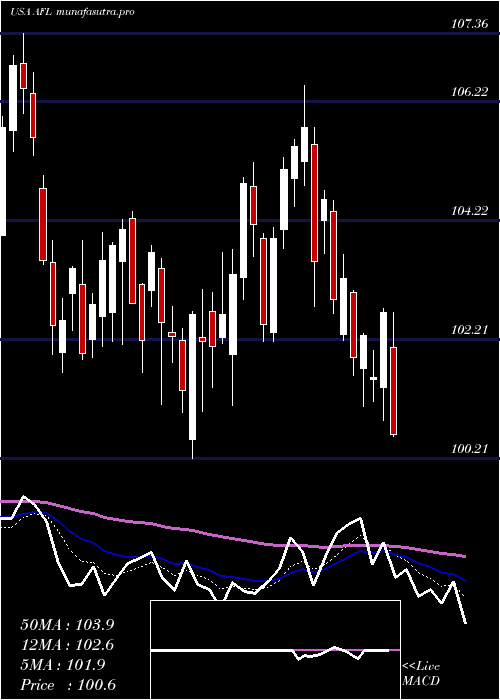
Daily price and charts and targets AflacIncorporated Strong Daily Stock price targets for AflacIncorporated AFL are 107.34 and 108.42 | Daily Target 1 | 106.49 | | Daily Target 2 | 107.1 | | Daily Target 3 | 107.57 | | Daily Target 4 | 108.18 | | Daily Target 5 | 108.65 |
Daily price and volume Aflac Incorporated
| Date |
Closing |
Open |
Range |
Volume |
Fri 17 October 2025 |
107.71 (0.92%) |
107.09 |
106.96 - 108.04 |
0.9157 times |
Thu 16 October 2025 |
106.73 (-2.8%) |
109.03 |
106.46 - 109.03 |
1.235 times |
Wed 15 October 2025 |
109.81 (-1.52%) |
111.01 |
109.39 - 112.00 |
0.9444 times |
Tue 14 October 2025 |
111.51 (1.13%) |
110.24 |
109.89 - 111.57 |
1.0905 times |
Mon 13 October 2025 |
110.26 (-0.62%) |
110.57 |
109.69 - 111.59 |
1.1965 times |
Fri 10 October 2025 |
110.95 (-0.2%) |
112.14 |
110.64 - 112.33 |
0.9031 times |
Thu 09 October 2025 |
111.17 (-0.65%) |
112.40 |
110.75 - 113.36 |
0.9895 times |
Wed 08 October 2025 |
111.90 (-0.91%) |
113.00 |
111.74 - 113.29 |
1.0714 times |
Tue 07 October 2025 |
112.93 (-0.12%) |
113.33 |
112.55 - 113.90 |
1.0486 times |
Mon 06 October 2025 |
113.07 (0.67%) |
112.39 |
111.37 - 113.39 |
0.6053 times |
Fri 03 October 2025 |
112.32 (1.56%) |
110.57 |
110.06 - 112.42 |
0.9888 times |
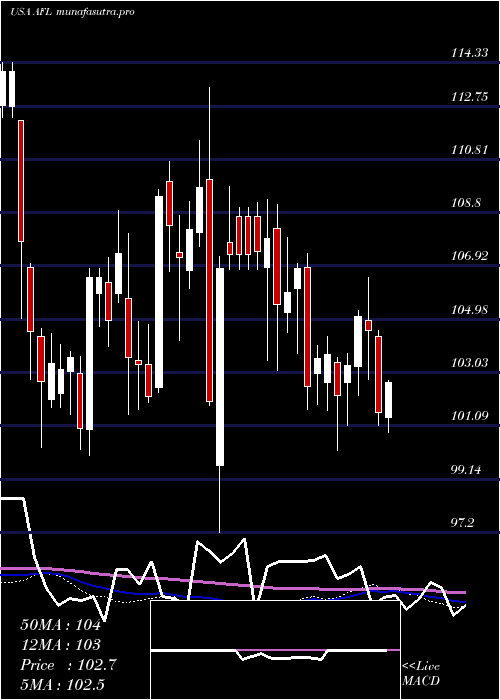
Weekly price and charts AflacIncorporated Strong weekly Stock price targets for AflacIncorporated AFL are 104.32 and 109.86 | Weekly Target 1 | 103.18 | | Weekly Target 2 | 105.45 | | Weekly Target 3 | 108.72333333333 | | Weekly Target 4 | 110.99 | | Weekly Target 5 | 114.26 |
Weekly price and volumes for Aflac Incorporated
| Date |
Closing |
Open |
Range |
Volume |
Fri 17 October 2025 |
107.71 (-2.92%) |
110.57 |
106.46 - 112.00 |
0.8469 times |
Fri 10 October 2025 |
110.95 (-1.22%) |
112.39 |
110.64 - 113.90 |
0.7266 times |
Fri 03 October 2025 |
112.32 (0.86%) |
111.45 |
109.66 - 112.42 |
0.8878 times |
Fri 26 September 2025 |
111.36 (3.07%) |
107.77 |
106.85 - 111.44 |
1.069 times |
Fri 19 September 2025 |
108.04 (-1%) |
109.04 |
106.96 - 109.99 |
1.6481 times |
Fri 12 September 2025 |
109.13 (2.06%) |
106.31 |
104.66 - 109.51 |
1.0196 times |
Fri 05 September 2025 |
106.93 (0.07%) |
106.63 |
104.75 - 108.95 |
0.9718 times |
Fri 29 August 2025 |
106.86 (0%) |
106.39 |
106.29 - 107.18 |
0.2302 times |
Fri 29 August 2025 |
106.86 (-1.48%) |
108.26 |
105.79 - 108.71 |
1.4143 times |
Fri 22 August 2025 |
108.46 (2.92%) |
105.44 |
104.99 - 109.65 |
1.1859 times |
Fri 15 August 2025 |
105.38 (1.8%) |
103.95 |
103.28 - 106.16 |
1.2391 times |
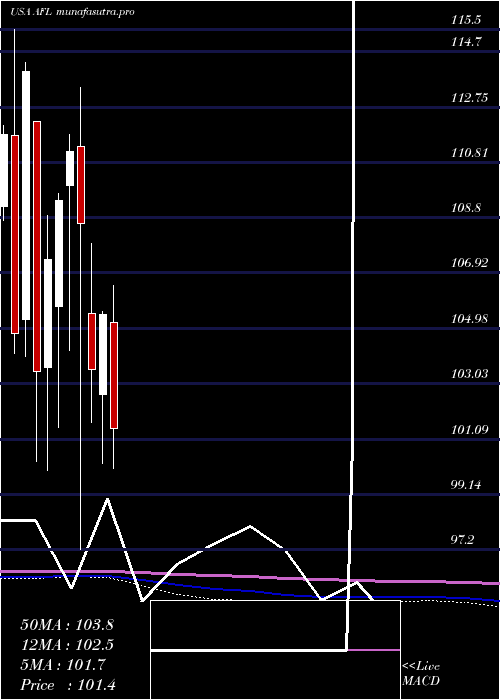
Monthly price and charts AflacIncorporated Strong monthly Stock price targets for AflacIncorporated AFL are 103.37 and 110.81 | Monthly Target 1 | 101.92 | | Monthly Target 2 | 104.81 | | Monthly Target 3 | 109.35666666667 | | Monthly Target 4 | 112.25 | | Monthly Target 5 | 116.8 |
Monthly price and volumes Aflac Incorporated
| Date |
Closing |
Open |
Range |
Volume |
Fri 17 October 2025 |
107.71 (-3.57%) |
111.00 |
106.46 - 113.90 |
0.4789 times |
Tue 30 September 2025 |
111.70 (4.53%) |
106.63 |
104.66 - 111.85 |
1.2382 times |
Fri 29 August 2025 |
106.86 (7.55%) |
99.41 |
96.95 - 109.65 |
1.3213 times |
Thu 31 July 2025 |
99.36 (-5.78%) |
105.20 |
98.05 - 106.48 |
1.0643 times |
Mon 30 June 2025 |
105.46 (1.85%) |
102.67 |
100.21 - 105.58 |
1.2299 times |
Fri 30 May 2025 |
103.54 (-4.73%) |
105.50 |
101.67 - 107.97 |
0.9851 times |
Wed 30 April 2025 |
108.68 (-2.26%) |
111.36 |
97.20 - 113.45 |
1.0124 times |
Mon 31 March 2025 |
111.19 (1.57%) |
110.00 |
104.21 - 111.78 |
0.9096 times |
Fri 28 February 2025 |
109.47 (1.95%) |
105.73 |
101.50 - 109.70 |
0.9262 times |
Fri 31 January 2025 |
107.38 (3.81%) |
103.61 |
100.00 - 108.93 |
0.8341 times |
Tue 31 December 2024 |
103.44 (-9.28%) |
112.24 |
100.30 - 112.24 |
0.7583 times |
DMA SMA EMA moving averages of Aflac Incorporated AFL
DMA (daily moving average) of Aflac Incorporated AFL
| DMA period | DMA value | | 5 day DMA | 109.2 | | 12 day DMA | 110.75 | | 20 day DMA | 110.43 | | 35 day DMA | 109.21 | | 50 day DMA | 108.39 | | 100 day DMA | 105.44 | | 150 day DMA | 105.9 | | 200 day DMA | 105.75 | EMA (exponential moving average) of Aflac Incorporated AFL
| EMA period | EMA current | EMA prev | EMA prev2 | | 5 day EMA | 108.85 | 109.42 | 110.76 | | 12 day EMA | 109.85 | 110.24 | 110.88 | | 20 day EMA | 109.83 | 110.05 | 110.4 | | 35 day EMA | 109.02 | 109.1 | 109.24 | | 50 day EMA | 107.85 | 107.86 | 107.91 |
SMA (simple moving average) of Aflac Incorporated AFL
| SMA period | SMA current | SMA prev | SMA prev2 | | 5 day SMA | 109.2 | 109.85 | 110.74 | | 12 day SMA | 110.75 | 111 | 111.41 | | 20 day SMA | 110.43 | 110.44 | 110.51 | | 35 day SMA | 109.21 | 109.18 | 109.16 | | 50 day SMA | 108.39 | 108.3 | 108.22 | | 100 day SMA | 105.44 | 105.39 | 105.34 | | 150 day SMA | 105.9 | 105.88 | 105.87 | | 200 day SMA | 105.75 | 105.73 | 105.71 |
|
|
