AgnicoEagle AEM full analysis,charts,indicators,moving averages,SMA,DMA,EMA,ADX,MACD,RSIAgnico Eagle AEM WideScreen charts, DMA,SMA,EMA technical analysis, forecast prediction, by indicators ADX,MACD,RSI,CCI USA stock exchange
operates under Basic Industries sector & deals in Precious Metals
Daily price and charts and targets AgnicoEagle Strong Daily Stock price targets for AgnicoEagle AEM are 169.47 and 173.85 | Daily Target 1 | 165.89 | | Daily Target 2 | 168.66 | | Daily Target 3 | 170.27 | | Daily Target 4 | 173.04 | | Daily Target 5 | 174.65 |
Daily price and volume Agnico Eagle
| Date |
Closing |
Open |
Range |
Volume |
Thu 04 December 2025 |
171.43 (1.33%) |
168.30 |
167.50 - 171.88 |
0.7599 times |
Wed 03 December 2025 |
169.18 (-0.37%) |
171.20 |
168.21 - 172.04 |
0.6382 times |
Tue 02 December 2025 |
169.80 (-1.28%) |
170.80 |
164.31 - 171.61 |
0.7034 times |
Mon 01 December 2025 |
172.01 (-1.39%) |
175.90 |
170.80 - 176.00 |
1.4147 times |
Fri 28 November 2025 |
174.43 (0.81%) |
175.00 |
172.48 - 175.25 |
0.7181 times |
Wed 26 November 2025 |
173.02 (4.31%) |
167.89 |
167.40 - 173.88 |
1.2526 times |
Tue 25 November 2025 |
165.87 (-0.2%) |
166.00 |
164.86 - 168.11 |
0.851 times |
Mon 24 November 2025 |
166.20 (3.87%) |
161.58 |
161.08 - 166.49 |
1.17 times |
Fri 21 November 2025 |
160.00 (0.88%) |
157.33 |
156.05 - 161.05 |
1.3114 times |
Thu 20 November 2025 |
158.60 (-5.41%) |
168.71 |
158.42 - 169.61 |
1.1808 times |
Wed 19 November 2025 |
167.67 (0.71%) |
169.55 |
166.22 - 172.59 |
0.9355 times |
Weekly price and charts AgnicoEagle Strong weekly Stock price targets for AgnicoEagle AEM are 162.03 and 173.72 | Weekly Target 1 | 158.89 | | Weekly Target 2 | 165.16 | | Weekly Target 3 | 170.58 | | Weekly Target 4 | 176.85 | | Weekly Target 5 | 182.27 |
Weekly price and volumes for Agnico Eagle
| Date |
Closing |
Open |
Range |
Volume |
Thu 04 December 2025 |
171.43 (-1.72%) |
175.90 |
164.31 - 176.00 |
0.6321 times |
Fri 28 November 2025 |
174.43 (9.02%) |
161.58 |
161.08 - 175.25 |
0.7176 times |
Fri 21 November 2025 |
160.00 (-4.82%) |
166.74 |
156.05 - 172.59 |
1.0893 times |
Fri 14 November 2025 |
168.11 (4.15%) |
165.00 |
161.18 - 174.67 |
0.9604 times |
Fri 07 November 2025 |
161.41 (0.37%) |
160.81 |
155.75 - 163.29 |
0.693 times |
Fri 31 October 2025 |
160.81 (0%) |
163.01 |
158.68 - 163.01 |
0.1997 times |
Fri 31 October 2025 |
160.81 (-1.56%) |
156.51 |
150.68 - 163.97 |
1.6963 times |
Fri 24 October 2025 |
163.36 (-7.06%) |
178.48 |
158.28 - 179.05 |
1.3948 times |
Fri 17 October 2025 |
175.77 (6.93%) |
167.51 |
167.51 - 188.74 |
1.2498 times |
Fri 10 October 2025 |
164.38 (-2.97%) |
171.24 |
160.15 - 172.97 |
1.367 times |
Fri 03 October 2025 |
169.42 (3.67%) |
167.49 |
163.86 - 172.38 |
1.2788 times |
Monthly price and charts AgnicoEagle Strong monthly Stock price targets for AgnicoEagle AEM are 162.03 and 173.72 | Monthly Target 1 | 158.89 | | Monthly Target 2 | 165.16 | | Monthly Target 3 | 170.58 | | Monthly Target 4 | 176.85 | | Monthly Target 5 | 182.27 |
Monthly price and volumes Agnico Eagle
| Date |
Closing |
Open |
Range |
Volume |
Thu 04 December 2025 |
171.43 (-1.72%) |
175.90 |
164.31 - 176.00 |
0.1153 times |
Fri 28 November 2025 |
174.43 (8.47%) |
160.81 |
155.75 - 175.25 |
0.6314 times |
Fri 31 October 2025 |
160.81 (-4.6%) |
169.59 |
150.68 - 188.74 |
1.1962 times |
Tue 30 September 2025 |
168.56 (16.92%) |
145.88 |
142.90 - 169.38 |
1.3025 times |
Fri 29 August 2025 |
144.17 (15.93%) |
127.57 |
123.94 - 144.78 |
0.883 times |
Thu 31 July 2025 |
124.36 (4.57%) |
120.42 |
115.19 - 129.77 |
0.965 times |
Mon 30 June 2025 |
118.93 (0.8%) |
120.18 |
114.60 - 126.65 |
0.9772 times |
Fri 30 May 2025 |
117.99 (0.35%) |
114.75 |
103.38 - 119.32 |
1.4172 times |
Wed 30 April 2025 |
117.58 (8.46%) |
109.41 |
94.77 - 126.76 |
1.6467 times |
Mon 31 March 2025 |
108.41 (12.6%) |
97.88 |
94.37 - 110.36 |
0.8654 times |
Fri 28 February 2025 |
96.28 (3.59%) |
92.87 |
92.11 - 101.45 |
0.973 times |

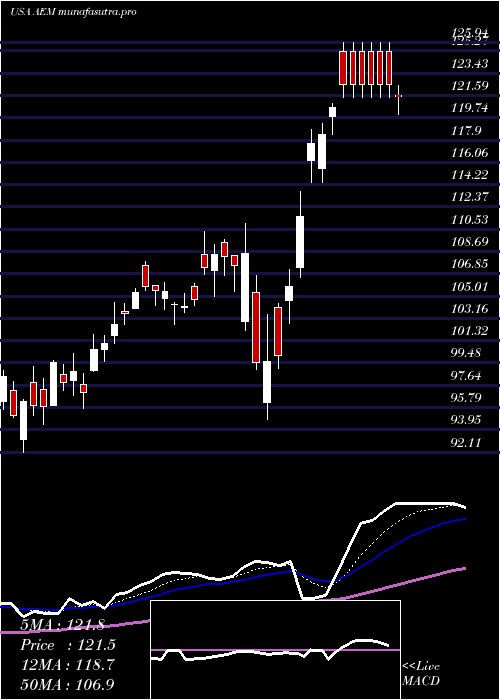
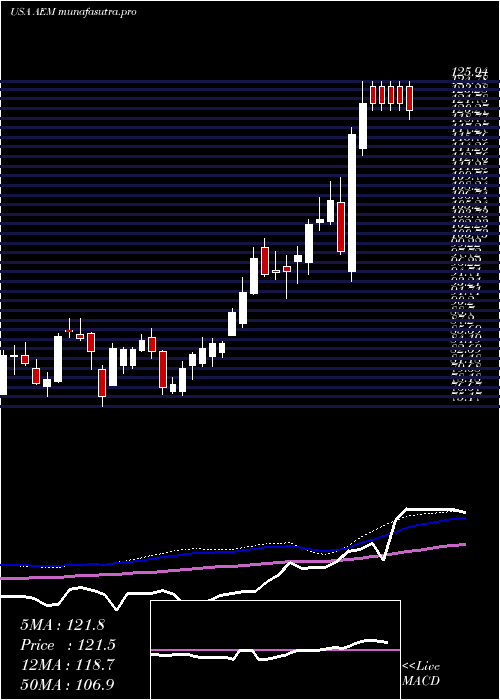
DMA SMA EMA moving averages of Agnico Eagle AEM
DMA (daily moving average) of Agnico Eagle AEM
| DMA period | DMA value | | 5 day DMA | 171.37 | | 12 day DMA | 167.89 | | 20 day DMA | 167.31 | | 35 day DMA | 166.06 | | 50 day DMA | 166.67 | | 100 day DMA | 152.91 | | 150 day DMA | 141.04 | | 200 day DMA | 132.85 | EMA (exponential moving average) of Agnico Eagle AEM
| EMA period | EMA current | EMA prev | EMA prev2 | | 5 day EMA | 170.42 | 169.91 | 170.27 | | 12 day EMA | 168.87 | 168.4 | 168.26 | | 20 day EMA | 167.7 | 167.31 | 167.11 | | 35 day EMA | 167.1 | 166.85 | 166.71 | | 50 day EMA | 166.53 | 166.33 | 166.21 |
SMA (simple moving average) of Agnico Eagle AEM
| SMA period | SMA current | SMA prev | SMA prev2 | | 5 day SMA | 171.37 | 171.69 | 171.03 | | 12 day SMA | 167.89 | 167.35 | 167.26 | | 20 day SMA | 167.31 | 166.72 | 166.06 | | 35 day SMA | 166.06 | 166.27 | 166.33 | | 50 day SMA | 166.67 | 166.4 | 166.26 | | 100 day SMA | 152.91 | 152.38 | 151.89 | | 150 day SMA | 141.04 | 140.68 | 140.33 | | 200 day SMA | 132.85 | 132.48 | 132.13 |
|
|
