AmerenCorporation AEE full analysis,charts,indicators,moving averages,SMA,DMA,EMA,ADX,MACD,RSIAmeren Corporation AEE WideScreen charts, DMA,SMA,EMA technical analysis, forecast prediction, by indicators ADX,MACD,RSI,CCI USA stock exchange
operates under Public Utilities sector & deals in Power Generation
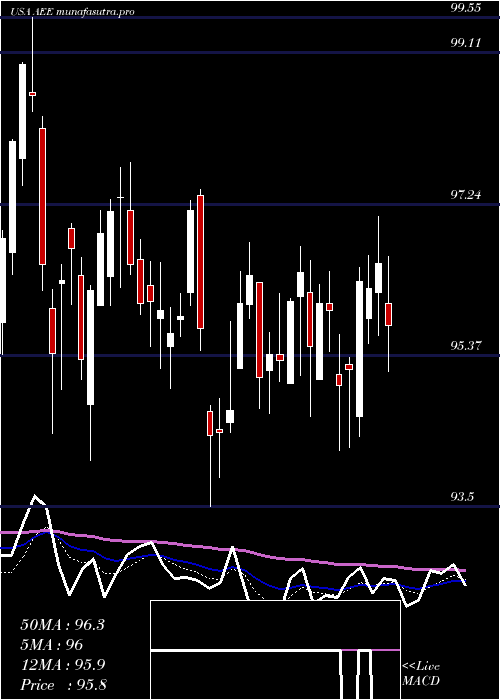
Daily price and charts and targets AmerenCorporation Strong Daily Stock price targets for AmerenCorporation AEE are 100.12 and 101.32 | Daily Target 1 | 99.88 | | Daily Target 2 | 100.36 | | Daily Target 3 | 101.07666666667 | | Daily Target 4 | 101.56 | | Daily Target 5 | 102.28 |
Daily price and volume Ameren Corporation
| Date |
Closing |
Open |
Range |
Volume |
Thu 04 December 2025 |
100.85 (-0.61%) |
101.09 |
100.59 - 101.79 |
1.6806 times |
Wed 03 December 2025 |
101.47 (-0.04%) |
101.55 |
100.34 - 102.05 |
1.4613 times |
Tue 02 December 2025 |
101.51 (-1.45%) |
103.41 |
101.51 - 103.41 |
1.0872 times |
Mon 01 December 2025 |
103.00 (-3.15%) |
105.98 |
102.87 - 106.11 |
0.9158 times |
Fri 28 November 2025 |
106.35 (0.31%) |
106.24 |
105.90 - 106.61 |
0.3133 times |
Wed 26 November 2025 |
106.02 (1.05%) |
105.41 |
105.01 - 106.15 |
0.6884 times |
Tue 25 November 2025 |
104.92 (0.12%) |
105.55 |
104.29 - 106.23 |
0.874 times |
Mon 24 November 2025 |
104.79 (0.25%) |
104.41 |
103.27 - 104.98 |
1.1024 times |
Fri 21 November 2025 |
104.53 (1.03%) |
103.78 |
103.04 - 104.96 |
1.1366 times |
Thu 20 November 2025 |
103.46 (0.46%) |
103.58 |
103.22 - 104.46 |
0.7404 times |
Wed 19 November 2025 |
102.99 (-1.82%) |
104.73 |
102.82 - 104.81 |
1.0641 times |
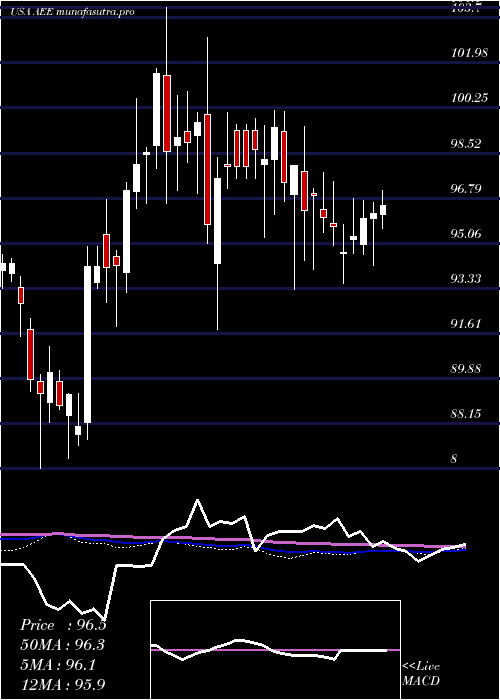
Weekly price and charts AmerenCorporation Strong weekly Stock price targets for AmerenCorporation AEE are 97.71 and 103.48 | Weekly Target 1 | 96.66 | | Weekly Target 2 | 98.76 | | Weekly Target 3 | 102.43333333333 | | Weekly Target 4 | 104.53 | | Weekly Target 5 | 108.2 |
Weekly price and volumes for Ameren Corporation
| Date |
Closing |
Open |
Range |
Volume |
Thu 04 December 2025 |
100.85 (-5.17%) |
105.98 |
100.34 - 106.11 |
1.1726 times |
Fri 28 November 2025 |
106.35 (1.74%) |
104.41 |
103.27 - 106.61 |
0.6788 times |
Fri 21 November 2025 |
104.53 (-0.47%) |
105.53 |
102.82 - 106.08 |
1.2247 times |
Fri 14 November 2025 |
105.02 (0.35%) |
104.03 |
103.80 - 105.92 |
1.047 times |
Fri 07 November 2025 |
104.65 (2.58%) |
102.11 |
100.86 - 104.83 |
1.1465 times |
Fri 31 October 2025 |
102.02 (0%) |
102.11 |
101.61 - 102.64 |
0.2198 times |
Fri 31 October 2025 |
102.02 (-2.17%) |
104.38 |
101.61 - 104.94 |
0.9185 times |
Fri 24 October 2025 |
104.28 (-1.18%) |
106.16 |
104.02 - 106.73 |
0.9727 times |
Fri 17 October 2025 |
105.52 (1.78%) |
103.53 |
103.26 - 106.23 |
1.2355 times |
Fri 10 October 2025 |
103.67 (-0.07%) |
104.09 |
102.96 - 105.79 |
1.384 times |
Fri 03 October 2025 |
103.74 (1.61%) |
102.28 |
101.74 - 104.52 |
1.2304 times |
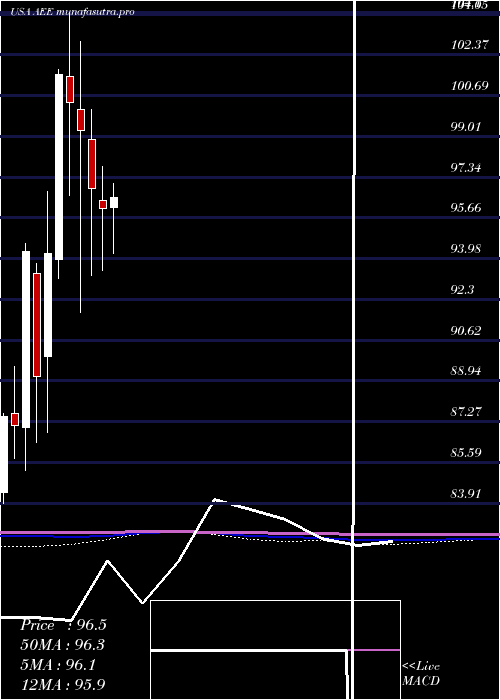
Monthly price and charts AmerenCorporation Strong monthly Stock price targets for AmerenCorporation AEE are 97.71 and 103.48 | Monthly Target 1 | 96.66 | | Monthly Target 2 | 98.76 | | Monthly Target 3 | 102.43333333333 | | Monthly Target 4 | 104.53 | | Monthly Target 5 | 108.2 |
Monthly price and volumes Ameren Corporation
| Date |
Closing |
Open |
Range |
Volume |
Thu 04 December 2025 |
100.85 (-5.17%) |
105.98 |
100.34 - 106.11 |
0.2677 times |
Fri 28 November 2025 |
106.35 (4.24%) |
102.11 |
100.86 - 106.61 |
0.9354 times |
Fri 31 October 2025 |
102.02 (-2.26%) |
104.05 |
101.61 - 106.73 |
1.2572 times |
Tue 30 September 2025 |
104.38 (4.61%) |
99.63 |
97.90 - 104.50 |
0.9356 times |
Fri 29 August 2025 |
99.78 (-1.33%) |
102.54 |
99.43 - 103.54 |
0.933 times |
Thu 31 July 2025 |
101.13 (5.3%) |
96.10 |
94.20 - 101.58 |
1.048 times |
Mon 30 June 2025 |
96.04 (-0.87%) |
96.35 |
93.50 - 97.76 |
1.1065 times |
Fri 30 May 2025 |
96.88 (-2.38%) |
98.89 |
93.27 - 100.14 |
1.1285 times |
Wed 30 April 2025 |
99.24 (-1.16%) |
100.13 |
91.77 - 102.94 |
1.1227 times |
Mon 31 March 2025 |
100.40 (-1.14%) |
101.49 |
96.59 - 104.10 |
1.2654 times |
Fri 28 February 2025 |
101.56 (7.81%) |
93.96 |
93.16 - 101.75 |
1.2688 times |
DMA SMA EMA moving averages of Ameren Corporation AEE
DMA (daily moving average) of Ameren Corporation AEE
| DMA period | DMA value | | 5 day DMA | 102.64 | | 12 day DMA | 103.73 | | 20 day DMA | 104.09 | | 35 day DMA | 103.93 | | 50 day DMA | 103.83 | | 100 day DMA | 102.06 | | 150 day DMA | 100.18 | | 200 day DMA | 99.82 | EMA (exponential moving average) of Ameren Corporation AEE
| EMA period | EMA current | EMA prev | EMA prev2 | | 5 day EMA | 102.21 | 102.89 | 103.6 | | 12 day EMA | 103.27 | 103.71 | 104.12 | | 20 day EMA | 103.57 | 103.86 | 104.11 | | 35 day EMA | 103.62 | 103.78 | 103.92 | | 50 day EMA | 103.36 | 103.46 | 103.54 |
SMA (simple moving average) of Ameren Corporation AEE
| SMA period | SMA current | SMA prev | SMA prev2 | | 5 day SMA | 102.64 | 103.67 | 104.36 | | 12 day SMA | 103.73 | 104.11 | 104.41 | | 20 day SMA | 104.09 | 104.11 | 104.14 | | 35 day SMA | 103.93 | 104.06 | 104.14 | | 50 day SMA | 103.83 | 103.83 | 103.82 | | 100 day SMA | 102.06 | 102.01 | 101.96 | | 150 day SMA | 100.18 | 100.17 | 100.16 | | 200 day SMA | 99.82 | 99.81 | 99.79 |
|
|
