AdtranInc ADTN full analysis,charts,indicators,moving averages,SMA,DMA,EMA,ADX,MACD,RSIAdtran Inc ADTN WideScreen charts, DMA,SMA,EMA technical analysis, forecast prediction, by indicators ADX,MACD,RSI,CCI USA stock exchange
operates under Public Utilities sector & deals in Telecommunications Equipment
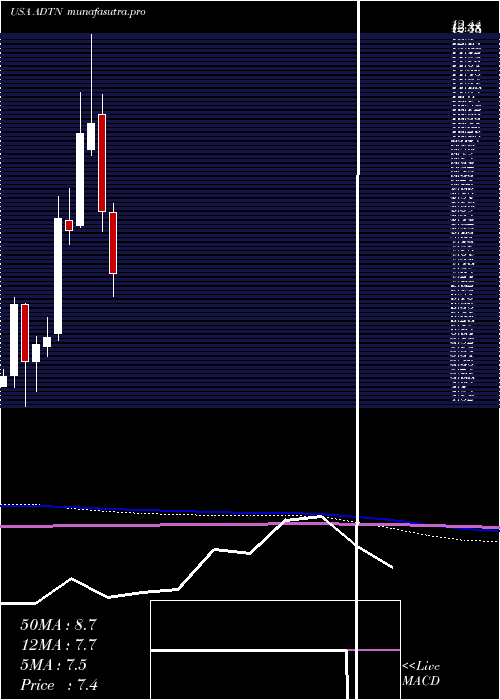
Daily price and charts and targets AdtranInc Strong Daily Stock price targets for AdtranInc ADTN are 8.45 and 8.63 | Daily Target 1 | 8.3 | | Daily Target 2 | 8.42 | | Daily Target 3 | 8.4833333333333 | | Daily Target 4 | 8.6 | | Daily Target 5 | 8.66 |
Daily price and volume Adtran Inc
| Date |
Closing |
Open |
Range |
Volume |
Fri 05 December 2025 |
8.53 (-0.12%) |
8.43 |
8.37 - 8.55 |
0.5607 times |
Thu 04 December 2025 |
8.54 (3.77%) |
8.23 |
8.23 - 8.60 |
2.2825 times |
Wed 03 December 2025 |
8.23 (1.35%) |
8.15 |
8.12 - 8.33 |
0.6836 times |
Tue 02 December 2025 |
8.12 (2.65%) |
7.97 |
7.95 - 8.36 |
0.6035 times |
Mon 01 December 2025 |
7.91 (-0.25%) |
7.88 |
7.75 - 8.22 |
1.3033 times |
Fri 28 November 2025 |
7.93 (-0.63%) |
8.02 |
7.89 - 8.05 |
0.3646 times |
Wed 26 November 2025 |
7.98 (3.64%) |
7.75 |
7.70 - 8.10 |
1.04 times |
Tue 25 November 2025 |
7.70 (4.76%) |
7.37 |
7.30 - 7.85 |
1.5293 times |
Mon 24 November 2025 |
7.35 (1.38%) |
7.30 |
7.30 - 7.43 |
0.5996 times |
Fri 21 November 2025 |
7.25 (-2.03%) |
7.37 |
7.24 - 7.48 |
1.0329 times |
Thu 20 November 2025 |
7.40 (-0.94%) |
7.73 |
7.34 - 7.77 |
0.8577 times |

Weekly price and charts AdtranInc Strong weekly Stock price targets for AdtranInc ADTN are 8.14 and 8.99 | Weekly Target 1 | 7.44 | | Weekly Target 2 | 7.99 | | Weekly Target 3 | 8.2933333333333 | | Weekly Target 4 | 8.84 | | Weekly Target 5 | 9.14 |
Weekly price and volumes for Adtran Inc
| Date |
Closing |
Open |
Range |
Volume |
Fri 05 December 2025 |
8.53 (7.57%) |
7.88 |
7.75 - 8.60 |
1.1571 times |
Fri 28 November 2025 |
7.93 (9.38%) |
7.30 |
7.30 - 8.10 |
0.7525 times |
Fri 21 November 2025 |
7.25 (-2.95%) |
7.41 |
7.11 - 7.77 |
0.8589 times |
Fri 14 November 2025 |
7.47 (-6.27%) |
8.20 |
7.38 - 8.32 |
0.9914 times |
Fri 07 November 2025 |
7.97 (-23.51%) |
9.12 |
7.71 - 9.14 |
1.9656 times |
Fri 31 October 2025 |
10.42 (0%) |
10.59 |
10.25 - 10.75 |
0.2882 times |
Fri 31 October 2025 |
10.42 (3.48%) |
10.17 |
9.88 - 10.75 |
1.2595 times |
Fri 24 October 2025 |
10.07 (11.39%) |
9.16 |
9.04 - 10.16 |
0.9614 times |
Fri 17 October 2025 |
9.04 (4.99%) |
8.84 |
8.40 - 9.53 |
0.8108 times |
Fri 10 October 2025 |
8.61 (-6.92%) |
9.36 |
8.49 - 9.39 |
0.9547 times |
Fri 03 October 2025 |
9.25 (-0.32%) |
9.36 |
9.17 - 9.66 |
0.8538 times |

Monthly price and charts AdtranInc Strong monthly Stock price targets for AdtranInc ADTN are 8.14 and 8.99 | Monthly Target 1 | 7.44 | | Monthly Target 2 | 7.99 | | Monthly Target 3 | 8.2933333333333 | | Monthly Target 4 | 8.84 | | Monthly Target 5 | 9.14 |
Monthly price and volumes Adtran Inc
| Date |
Closing |
Open |
Range |
Volume |
Fri 05 December 2025 |
8.53 (7.57%) |
7.88 |
7.75 - 8.60 |
0.3339 times |
Fri 28 November 2025 |
7.93 (-23.9%) |
9.12 |
7.11 - 9.14 |
1.3183 times |
Fri 31 October 2025 |
10.42 (11.09%) |
9.29 |
8.40 - 10.75 |
1.3742 times |
Tue 30 September 2025 |
9.38 (0%) |
9.14 |
8.61 - 10.64 |
1.9837 times |
Fri 29 August 2025 |
9.38 (0.97%) |
9.10 |
7.95 - 9.49 |
0.85 times |
Thu 31 July 2025 |
9.29 (3.57%) |
8.88 |
8.71 - 10.23 |
0.9724 times |
Mon 30 June 2025 |
8.97 (11.71%) |
8.06 |
7.42 - 9.17 |
0.8411 times |
Fri 30 May 2025 |
8.03 (4.83%) |
7.72 |
7.49 - 8.67 |
0.7426 times |
Wed 30 April 2025 |
7.66 (-12.16%) |
8.70 |
6.93 - 8.90 |
0.6672 times |
Mon 31 March 2025 |
8.72 (-17.5%) |
10.77 |
8.30 - 11.18 |
0.9167 times |
Fri 28 February 2025 |
10.57 (1.93%) |
10.02 |
9.91 - 12.44 |
1.0484 times |
DMA SMA EMA moving averages of Adtran Inc ADTN
DMA (daily moving average) of Adtran Inc ADTN
| DMA period | DMA value | | 5 day DMA | 8.27 | | 12 day DMA | 7.87 | | 20 day DMA | 7.81 | | 35 day DMA | 8.54 | | 50 day DMA | 8.71 | | 100 day DMA | 9.01 | | 150 day DMA | 8.81 | | 200 day DMA | 8.8 | EMA (exponential moving average) of Adtran Inc ADTN
| EMA period | EMA current | EMA prev | EMA prev2 | | 5 day EMA | 8.3 | 8.19 | 8.02 | | 12 day EMA | 8.09 | 8.01 | 7.91 | | 20 day EMA | 8.13 | 8.09 | 8.04 | | 35 day EMA | 8.33 | 8.32 | 8.31 | | 50 day EMA | 8.73 | 8.74 | 8.75 |
SMA (simple moving average) of Adtran Inc ADTN
| SMA period | SMA current | SMA prev | SMA prev2 | | 5 day SMA | 8.27 | 8.15 | 8.03 | | 12 day SMA | 7.87 | 7.76 | 7.66 | | 20 day SMA | 7.81 | 7.78 | 7.78 | | 35 day SMA | 8.54 | 8.57 | 8.59 | | 50 day SMA | 8.71 | 8.73 | 8.75 | | 100 day SMA | 9.01 | 9.02 | 9.03 | | 150 day SMA | 8.81 | 8.8 | 8.8 | | 200 day SMA | 8.8 | 8.81 | 8.83 |
|
|
