AdtInc ADT full analysis,charts,indicators,moving averages,SMA,DMA,EMA,ADX,MACD,RSIAdt Inc ADT WideScreen charts, DMA,SMA,EMA technical analysis, forecast prediction, by indicators ADX,MACD,RSI,CCI USA stock exchange
operates under Consumer Services sector & deals in Diversified Commercial Services
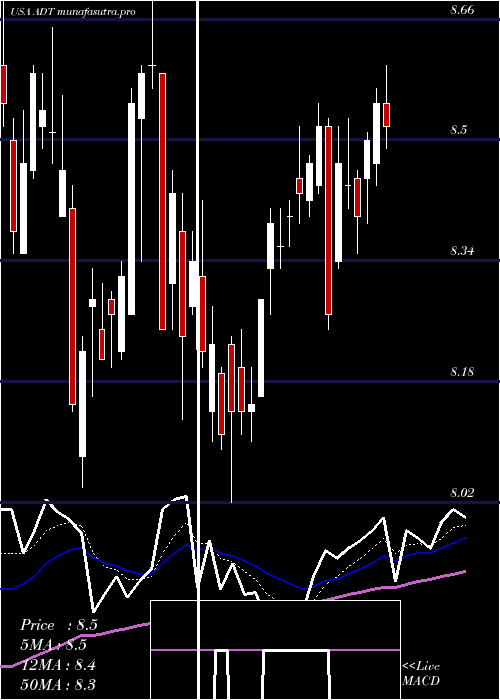
Daily price and charts and targets AdtInc Strong Daily Stock price targets for AdtInc ADT are 8.05 and 8.16 | Daily Target 1 | 8.03 | | Daily Target 2 | 8.07 | | Daily Target 3 | 8.14 | | Daily Target 4 | 8.18 | | Daily Target 5 | 8.25 |
Daily price and volume Adt Inc
| Date |
Closing |
Open |
Range |
Volume |
Thu 04 December 2025 |
8.11 (-0.37%) |
8.17 |
8.10 - 8.21 |
0.487 times |
Wed 03 December 2025 |
8.14 (0.25%) |
8.15 |
8.12 - 8.27 |
0.7597 times |
Tue 02 December 2025 |
8.12 (0.25%) |
8.16 |
8.11 - 8.20 |
1.2984 times |
Mon 01 December 2025 |
8.10 (-1.82%) |
8.16 |
8.09 - 8.26 |
1.4999 times |
Fri 28 November 2025 |
8.25 (1.1%) |
8.18 |
8.15 - 8.27 |
0.6253 times |
Wed 26 November 2025 |
8.16 (1.12%) |
8.07 |
8.05 - 8.20 |
1.118 times |
Tue 25 November 2025 |
8.07 (2.28%) |
7.89 |
7.89 - 8.07 |
0.926 times |
Mon 24 November 2025 |
7.89 (-0.13%) |
7.91 |
7.85 - 7.93 |
1.3391 times |
Fri 21 November 2025 |
7.90 (1.28%) |
7.82 |
7.79 - 7.97 |
0.979 times |
Thu 20 November 2025 |
7.80 (-0.76%) |
7.90 |
7.79 - 7.95 |
0.9676 times |
Wed 19 November 2025 |
7.86 (-1.38%) |
8.00 |
7.85 - 8.05 |
0.9009 times |
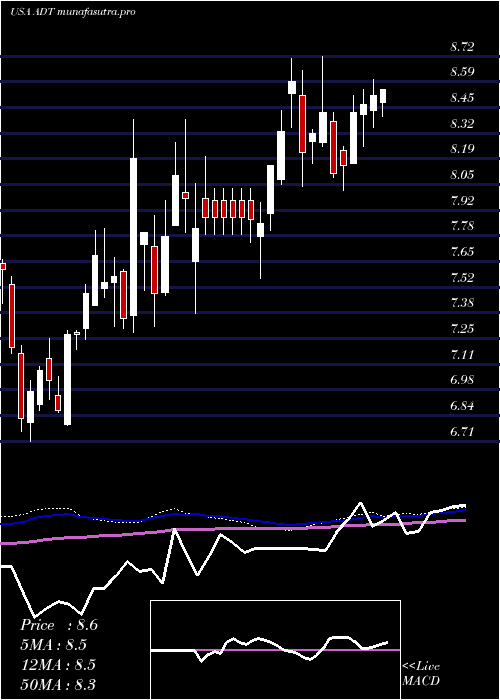
Weekly price and charts AdtInc Strong weekly Stock price targets for AdtInc ADT are 8.01 and 8.19 | Weekly Target 1 | 7.98 | | Weekly Target 2 | 8.04 | | Weekly Target 3 | 8.1566666666667 | | Weekly Target 4 | 8.22 | | Weekly Target 5 | 8.34 |
Weekly price and volumes for Adt Inc
| Date |
Closing |
Open |
Range |
Volume |
Thu 04 December 2025 |
8.11 (-1.7%) |
8.16 |
8.09 - 8.27 |
0.875 times |
Fri 28 November 2025 |
8.25 (4.43%) |
7.91 |
7.85 - 8.27 |
0.8671 times |
Fri 21 November 2025 |
7.90 (-4.36%) |
8.25 |
7.79 - 8.26 |
1.0091 times |
Fri 14 November 2025 |
8.26 (-0.12%) |
8.28 |
8.10 - 8.50 |
1.3503 times |
Fri 07 November 2025 |
8.27 (-6.45%) |
8.69 |
7.76 - 8.69 |
1.4722 times |
Fri 31 October 2025 |
8.84 (0%) |
8.75 |
8.70 - 8.86 |
0.1944 times |
Fri 31 October 2025 |
8.84 (0.91%) |
8.79 |
8.54 - 8.86 |
0.9861 times |
Fri 24 October 2025 |
8.76 (1.62%) |
8.63 |
8.56 - 8.81 |
0.8906 times |
Fri 17 October 2025 |
8.62 (2.99%) |
8.50 |
8.43 - 8.69 |
1.1465 times |
Fri 10 October 2025 |
8.37 (-4.89%) |
8.80 |
8.37 - 8.85 |
1.2087 times |
Fri 03 October 2025 |
8.80 (-0.11%) |
8.82 |
8.62 - 8.86 |
1.1938 times |
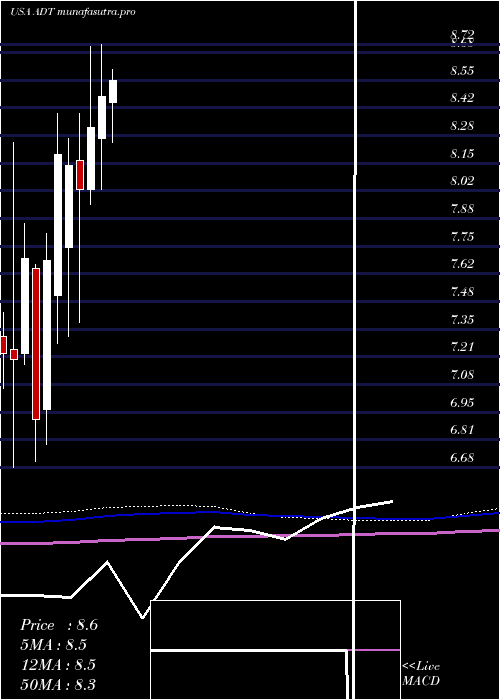
Monthly price and charts AdtInc Strong monthly Stock price targets for AdtInc ADT are 8.01 and 8.19 | Monthly Target 1 | 7.98 | | Monthly Target 2 | 8.04 | | Monthly Target 3 | 8.1566666666667 | | Monthly Target 4 | 8.22 | | Monthly Target 5 | 8.34 |
Monthly price and volumes Adt Inc
| Date |
Closing |
Open |
Range |
Volume |
Thu 04 December 2025 |
8.11 (-1.7%) |
8.16 |
8.09 - 8.27 |
0.0993 times |
Fri 28 November 2025 |
8.25 (-6.67%) |
8.69 |
7.76 - 8.69 |
0.533 times |
Fri 31 October 2025 |
8.84 (1.49%) |
8.69 |
8.37 - 8.86 |
0.588 times |
Tue 30 September 2025 |
8.71 (0%) |
8.66 |
8.49 - 8.94 |
0.8227 times |
Fri 29 August 2025 |
8.71 (4.31%) |
8.34 |
8.15 - 8.86 |
0.7926 times |
Thu 31 July 2025 |
8.35 (-1.42%) |
8.44 |
8.25 - 8.80 |
1.172 times |
Mon 30 June 2025 |
8.47 (1.8%) |
8.27 |
8.02 - 8.72 |
1.4299 times |
Fri 30 May 2025 |
8.32 (3.74%) |
8.02 |
7.95 - 8.71 |
1.6113 times |
Wed 30 April 2025 |
8.02 (-1.47%) |
8.16 |
7.38 - 8.39 |
1.3643 times |
Mon 31 March 2025 |
8.14 (-0.61%) |
7.74 |
7.31 - 8.27 |
1.587 times |
Fri 28 February 2025 |
8.19 (6.64%) |
7.51 |
7.28 - 8.39 |
0.7234 times |
DMA SMA EMA moving averages of Adt Inc ADT
DMA (daily moving average) of Adt Inc ADT
| DMA period | DMA value | | 5 day DMA | 8.14 | | 12 day DMA | 8.03 | | 20 day DMA | 8.1 | | 35 day DMA | 8.32 | | 50 day DMA | 8.42 | | 100 day DMA | 8.51 | | 150 day DMA | 8.46 | | 200 day DMA | 8.3 | EMA (exponential moving average) of Adt Inc ADT
| EMA period | EMA current | EMA prev | EMA prev2 | | 5 day EMA | 8.12 | 8.12 | 8.11 | | 12 day EMA | 8.11 | 8.11 | 8.11 | | 20 day EMA | 8.16 | 8.17 | 8.17 | | 35 day EMA | 8.26 | 8.27 | 8.28 | | 50 day EMA | 8.42 | 8.43 | 8.44 |
SMA (simple moving average) of Adt Inc ADT
| SMA period | SMA current | SMA prev | SMA prev2 | | 5 day SMA | 8.14 | 8.15 | 8.14 | | 12 day SMA | 8.03 | 8.02 | 8.03 | | 20 day SMA | 8.1 | 8.1 | 8.1 | | 35 day SMA | 8.32 | 8.34 | 8.35 | | 50 day SMA | 8.42 | 8.43 | 8.44 | | 100 day SMA | 8.51 | 8.51 | 8.52 | | 150 day SMA | 8.46 | 8.46 | 8.46 | | 200 day SMA | 8.3 | 8.29 | 8.29 |
|
|
